Dating the Stock Market's Charts and Graphs
On this page, I have placed one chart or table from each chapter of the book Dating the Stock Market. There is a brief description of each figure or table underneath it. To get the full explanation of each illustration please pick up a copy of my book Dating the Stock Market.
Chapter 1
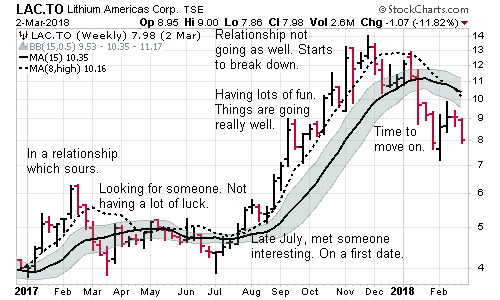
Figure 1.1
Chapter 2

Table 2.1 Overall Consistency
Chapter 3
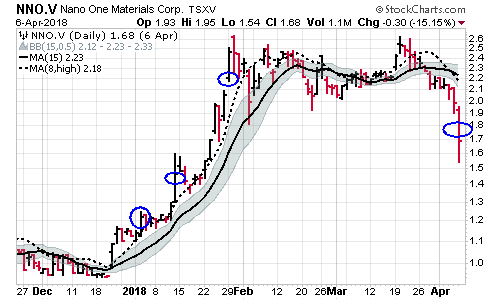
Figure 3.1 - Know When to Exit a Trade
Chapter 4
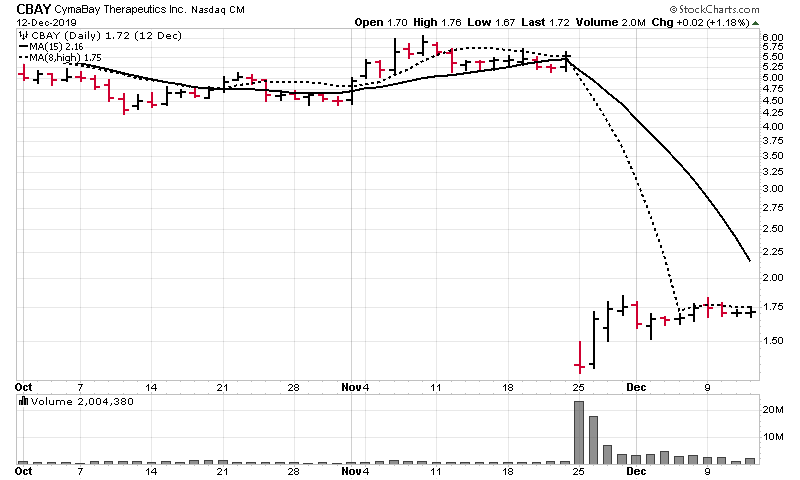
Figure 4.2 - Some Industries are Prone to Big Swings
Chapter 5
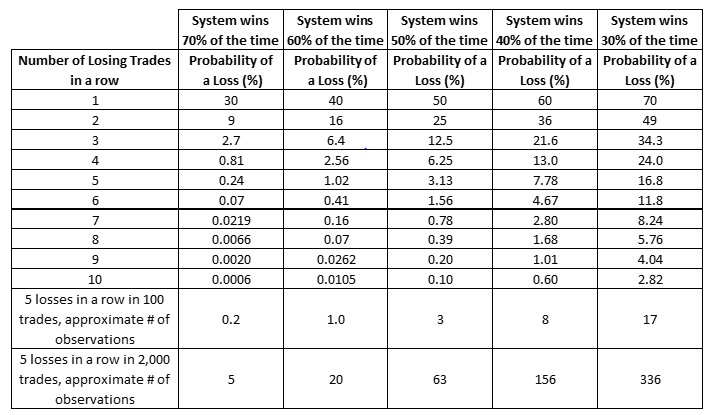
Table 5.1 - How many losses in a row can you handle?
Chapter 6
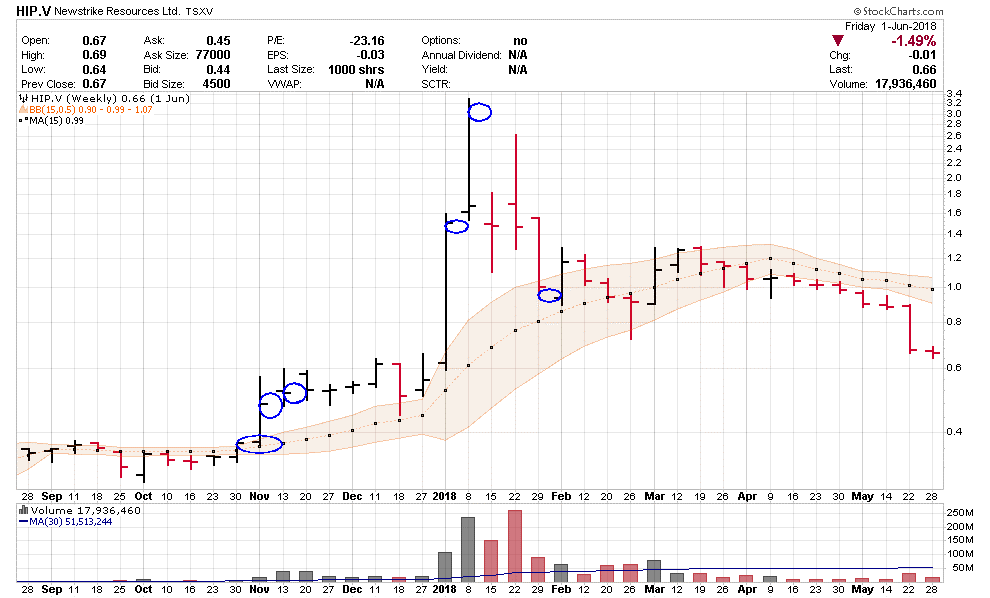
Figure 6.5 - Small stocks can really move
Chapter 7
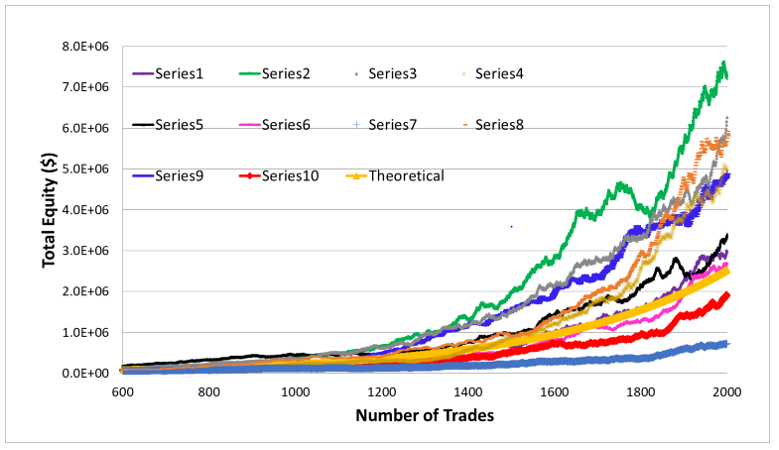
Figure 7.8 - Monte Carlo simulation of 2000 trades using a profit factor of 1.5
Chapter 8
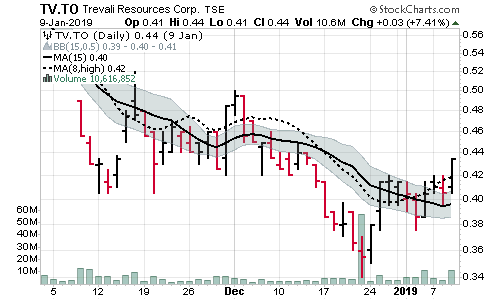
Figure 8.5 - This looks like a good set up, however the trade did not turn out that great.
Chapter 9
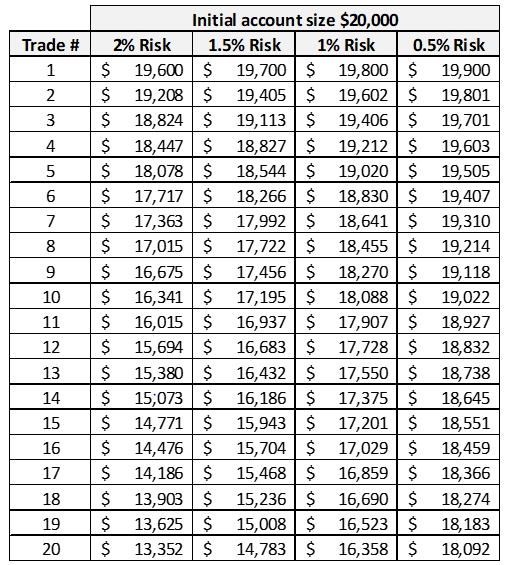
Table 9.2 - Account erosion due to multiple losses in a row and various risk percentages
Chapter 10

Table 10.1 - Stocks can be sorted by their strengths
I trust the above teasers have given you a few ideas about what is in the book Dating the Stock Market. I put over 50 charts and tables into the book to illustrate various ideas I have about trading the markets.
Which key mindset are you missing when it comes to trading. Find out by reading Dating the Stock Market - 10 Key Mindsets You Need to Excel as a Trader.
Bulls and bears are used to describe the up and down of the market. A bull tends to use its horns to lift oncoming threats out of
the way and raises them into the air which is the direction of a bull market. Bears
tend to come down on you from above hence they represent a bearish market or
one that is falling.
The above desk figurines depict the back and forth of the market as it unpredictably tends to move in a preferred direction. They make good gifts for traders, stock brokers or financial advisors.
Gifts for Stock Traders - Stock traders are a different breed. For the stock trader in your life or as a present to yourself consider getting a trading mug. This can be used throughout the day to sip on your favourite beverage and remind you that you are a trader.
Monte Carlo Simulator
for Traders
 Having troubles sticking with your trading system?
Do you move from system to system looking for the one system that will bring you riches?
Perhaps you already have it and tossed it aside when it went into a down period.
Using this Excel based program will show you what you can expect out of your trading system once you know the % wins and profit factor.
Stop wasting your time searching for the perfect system (which does not exist) and start trading.
$20.00

