What Is Monte Carlo Simulation?
These Two Numbers Will Impact Your Trading
For most people, Monte Carlo simulation has always been sort of a black box. People use it for a variety of purposes such as to determine the probability that something will happen. Yet it can provide you with two numbers which just might make a difference to your trading. Have you ever thought about applying it in your trading?
In trading, some of the things you can use Monte Carlo simulations for are to identify:
- The minimum winning percent trades you require psychologically
- The number of losing trades in a row
- The final equity of your system over a given time period
- The range of money that could potentially be made
- The number of winning trades in a row
- Periods of inactivity
The two number which I think are critical for you to know are how many losses in a row you can handle and how many losses in a row you can expect your system to deliver.
Knowing these numbers can be critical to designing your trading system. You may be wasting valuable time when you are unaware of the ranges your system could provide. Worse, you could abandon a perfectly good system, which you spent months creating, simply because you did not realize 5 losses in a row were highly probable.
The video below will give you a brief run through of the Monte Carlo Simulator for Traders.
For instance, many times traders state that they want a system which will win 50% of the time and the winners should be twice what your losers are. This sounds great in theory. However, do you understand what these numbers really mean? Using the Monte Carlo simulation tool, the graph below illustrates the equity curve of this system. It started with $10,000, initially risked $100 per trade (1% of equity) which means the initial winning trade made $200 or lost $100. After 2,000 trades, the final theoretical equity is $171,935,818 (orange curve) provided you continue to risk 1% of your equity.
Monte Carlo Simulation Shows Market Randomness
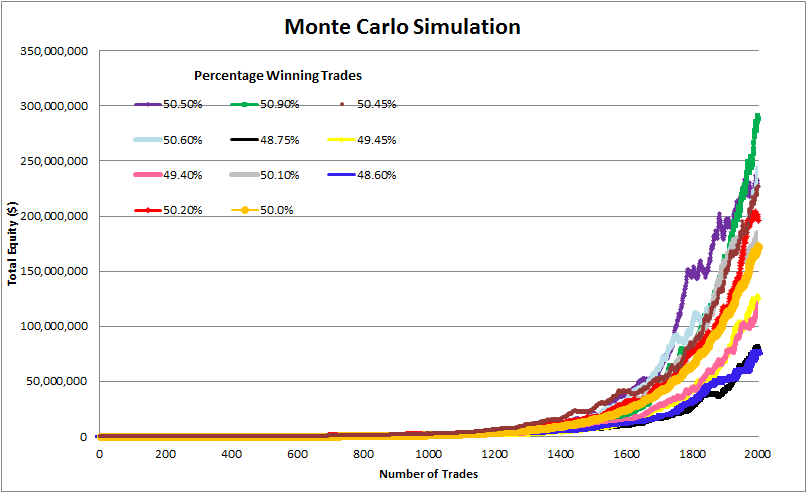
Looking at the final number, you might think this is ridiculous, yet the final equity number is relatively easy to calculate in Excel. By alternating a win and a loss 2000 times using the same win/loss criteria as above, a final equity of $171,935,818 is obtained.
Over a 30 year period this is the equivalent of getting about 38.5% on your money. I have heard of people getting these types of returns. For instance, Mark Minervini, a US Investing Champion, in his book Mindset Secrets for Winning, stated that he achieved results better than these. Also, it was mentioned in Van Tharp's book Trade Your Way to Financial Freedom, that one of his Super Trader's was achieving returns of 100+ %. However consider this: Warren Buffet's long term average is around 25% and long term record for the best Mutual Fund managers is around 20 to 25%.
It is apparent that some people are able to generate high returns than the majority of traders. When more than one person can do something, then there is a higher probability that you can do it as well. The question is - Are you willing to do what it takes to get these types of returns?
Monte Carlo Stock Simulation for Traders
A more realistic set of returns are shown below. For this Monte Carlo Simulation example, the winning percentage was 45% with winners being 1.8x that of losers. Here, after 2,000 trades, the theoretical amount (orange curve) is $1,484,958. Calculating the theoretical final equity can still be done because from Ralph Vince's book "The handbook of Portfolio Mathematics" the sequence of trades has no bearing on the final outcome. What is altered by the win/loss sequence is the size of the drawdowns and number of losses in a row.
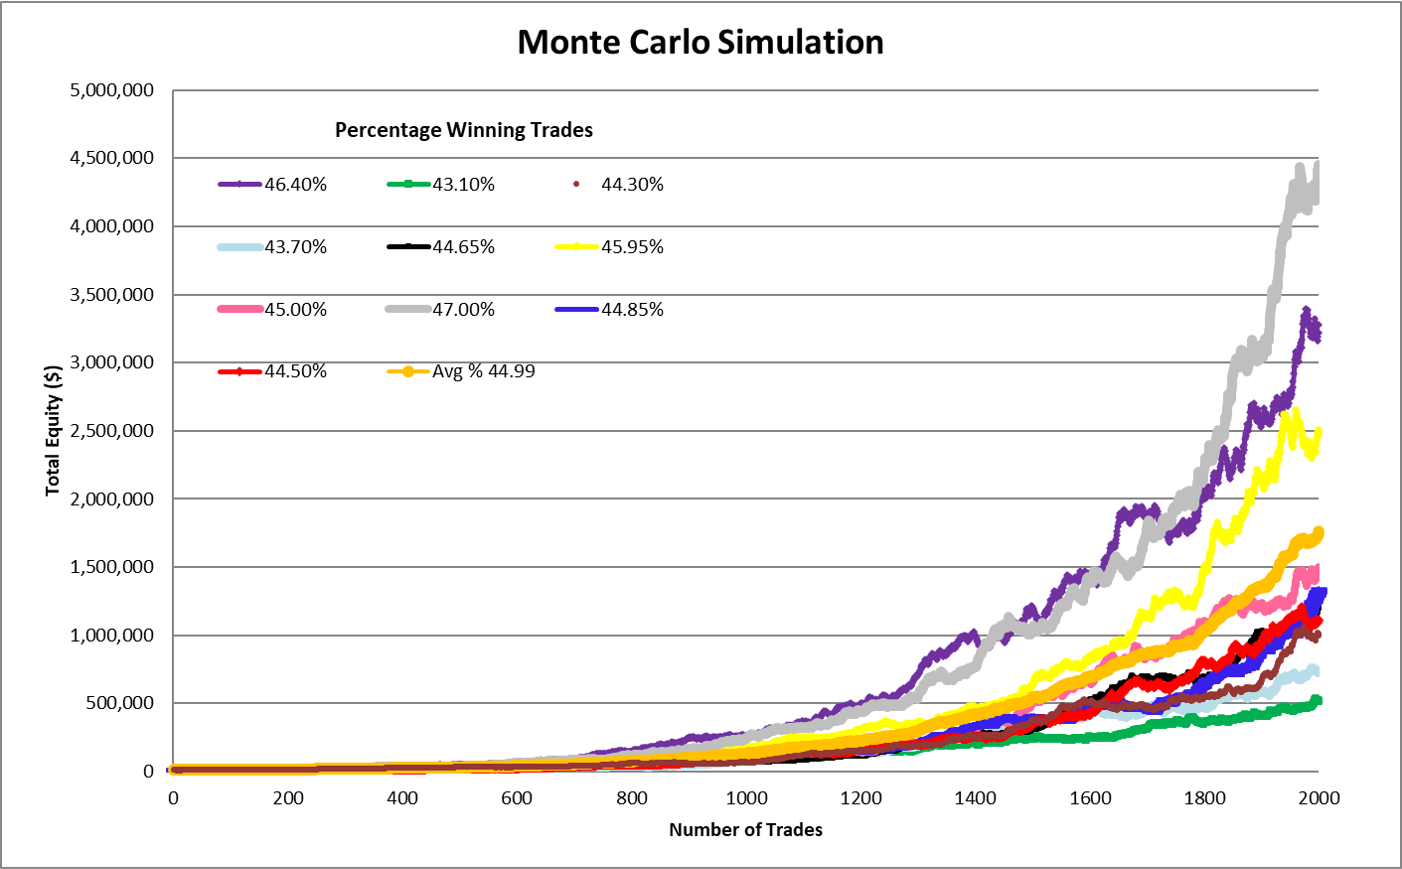
You many notice that there is a difference between the 2 graphs above. In the upper graph, I used a Theoretical line which was obtained by alternating between wins and losses. For the one just above I used the average of the 10 runs or what one could expect after 20,000 trades in 10 different accounts. The average is indicated by Avg. % and is in orange. It can be found in the bottom right of the legend.
The win/loss sequence is what tends to screw up a lot of traders. I know that until I accepted losing, I had a difficult time sticking to any one system. At one time in my StockFetcher account I had 86 scans. I was addicted to building scans instead of focusing on learning how to trade just a few well.
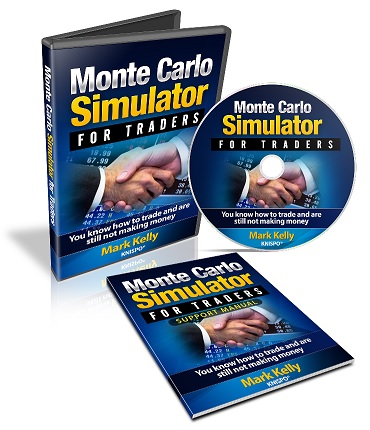
After I built the Monte Carlo Simulator for Traders Excel program I began to understand how many losses I should expect given a specific win/loss ratio. Knowing this I then figured out what type of system I needed to satisfy my psychology. This then allowed me to stick with my systems instead of always building new ones.
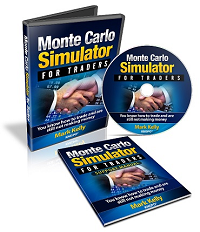
You may find that understanding what your trading system can and cannot deliver beneficial to your trading. If so, you can get a copy of the Monte Carlo Simulator for Traders Excel program with accompanying PDF support manual for $20. The link below will take you to PayPal which will then redirect you back to this site where you can download the Excel program and PDF manual.
Bulls and bears are used to describe the up and down of the market. A bull tends to use its horns to lift oncoming threats out of
the way and raises them into the air which is the direction of a bull market. Bears
tend to come down on you from above hence they represent a bearish market or
one that is falling.
The above desk figurines depict the back and forth of the market as it unpredictably tends to move in a preferred direction. They make good gifts for traders, stock brokers or financial advisors.
The Equity Curve
In the Monte Carlo Simulation Excel program there are 10 simulated equity curves and one average equity curve of the 10 calculated curves. The orange line is the average equity curve and grows by taking the average of the other 10 curves as the trades progress. The other lines are the results of a Monte Carlo simulation in which the average winning percentage is around 45%. As in the real world, this 45% average will ultimately come. However, it may take 20,000 trades to appear. The variability in returns is the result of the unknown return you will get over the next 2,000 trades. In the above equity graph, the lowest return was 43.10% while the highest was 47.00%. Note, in this example of 2,000 trades, improving your probability of a win from 43.1 to 47.0% will add about $4,000,000 to your account.
In this Excel based program, the Monte Carlo simulation curves can easily be recalculated to generate ten totally different curves (see below). The average curve will be similar but can move around quite a bit depending on the span between the highest and lowest trials.. In the case below, the spread is roughly from $600,000 to $2,800,000 which were obtained from winning 43.45% and 46.10% respectively.
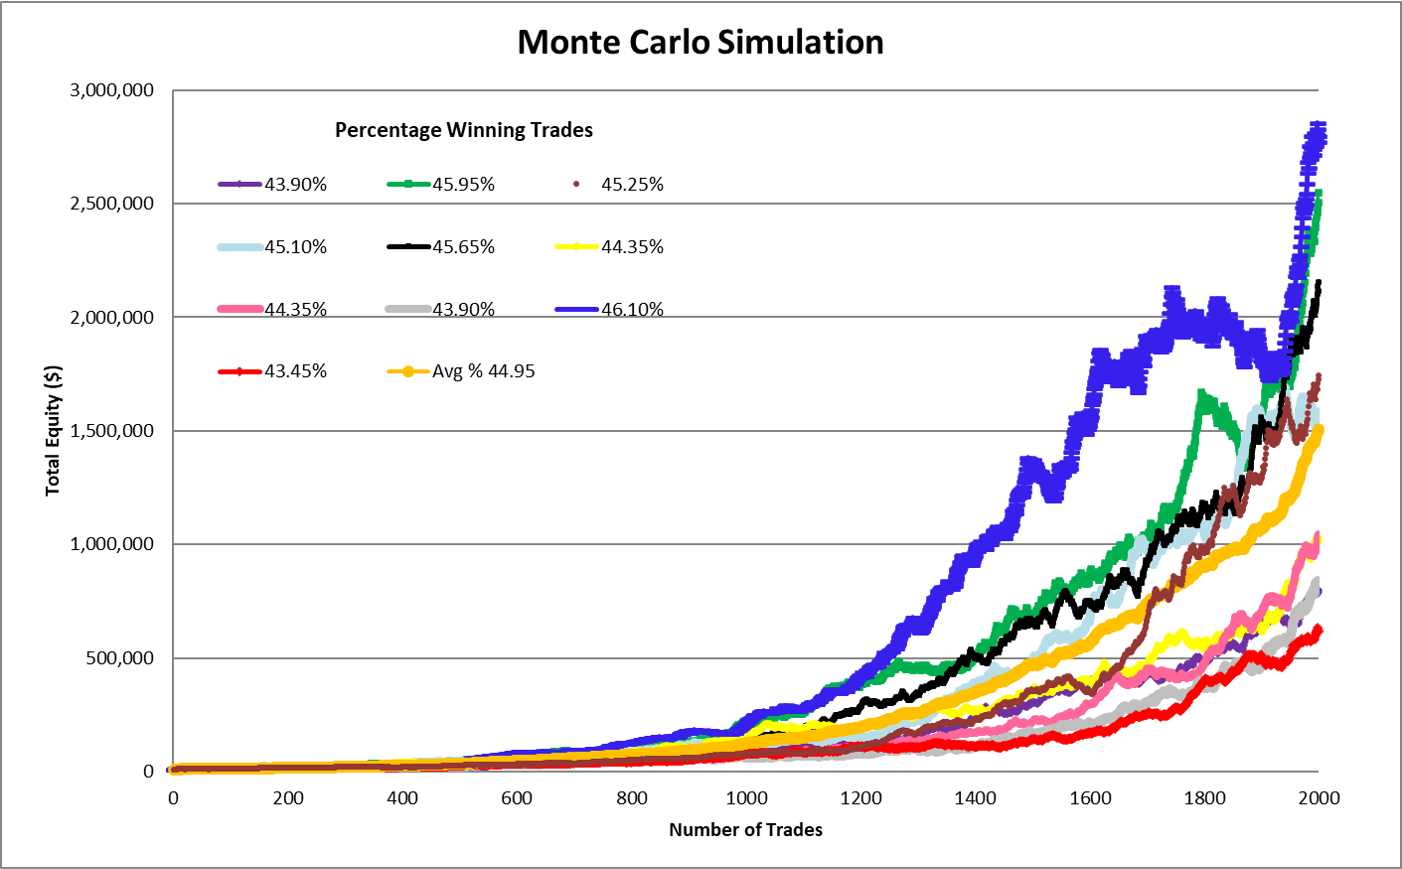
I realize that is an incredible difference for a system which is suppose to deliver 45% wins over 2,000 trades. That is the reality of the markets, you just don't know what each day, week, month or year will bring.
My guess is that most people would rather not know what their system returns. You may find this strange, however, I believe most people don't take 100 % responsibility for their lives or trading which would mean that most people don't trade consistently and therefore, are unlikely to know what type of returns they get. You, hopefully are willing to take 100% responsibility for your trading and want to be aware of the variability your system will deliver.
Having your own copy of the Monte Carlo Simulator for Traders will give you a good idea on where your trading system needs to be to let you sleep at night.
To get a more in-depth understanding of this program visit the Monte Carlo Simulator for Traders page.
Monte Carlo Simulator for Traders
I have found that using this Monte Carlo Simulation software has helped me understand what type of losses to expect and also what I should expect in regards to downturn and times when my equity curve will go no where.
The program also gives me an idea on what type of minimum winning percentage as well as the win / loss ratio I need to be satisfied from a psychological point of view.
After I got what I needed out of the program, I thought I might as well offer it to other traders who are looking for information which can make them feel more confident as they trade.

The Monte Carlo Simulator for Traders program costs $20. You can get a copy of it by following the link below. The link will take you to PayPal and once you have logged into PayPal you can apply any discount coupon you have. Once you have paid for the program, you will be redirected to a web-page where you can download the program.
If you have any questions about the program, please use the Contact me page to send me an email.
To learn more about Monte Carlo Simulator visit Investopedia.
Do you know how many losses you can handle?
Compound interest can be quite amazing. Check out these compound interest tables.
Understand the Profit Factor - which is a number you need to know about when developing your trading system.
Gifts for Stock Traders - Stock traders are a different breed. For the stock trader in your life or as a present to yourself consider getting a trading mug. This can be used throughout the day to sip on your favourite beverage and remind you that you are a trader.
Required Field*
Unsubscribe anytime
Your information is safe with us. View our Privacy Policy and Terms of Use
Monte Carlo Simulator
for Traders
 Having troubles sticking with your trading system?
Do you move from system to system looking for the one system that will bring you riches?
Perhaps you already have it and tossed it aside when it went into a down period.
Using this Excel based program will show you what you can expect out of your trading system once you know the % wins and profit factor.
Stop wasting your time searching for the perfect system (which does not exist) and start trading.
$20.00

