Stock option trading can enhance your returns
Understanding option trading is one thing that many stock traders fail to accomplish. Trading options can increase your yearly return, provided you use the proper methods to accomplish this. The main advantage of options is leverage. For instance, while you may only have enough cash in your account to buy 100 shares of a specific stock, if it is optionable, you may be able to control 1000 shares of the same stock, at least for a while.
Bulls and bears are used to describe the up and down of the market. A bull tends to use its horns to lift oncoming threats out of
the way and raises them into the air which is the direction of a bull market. Bears
tend to come down on you from above hence they represent a bearish market or
one that is falling.
The above desk figurines depict the back and forth of the market as it unpredictably tends to move in a preferred direction. They make good gifts for traders, stock brokers or financial advisors.
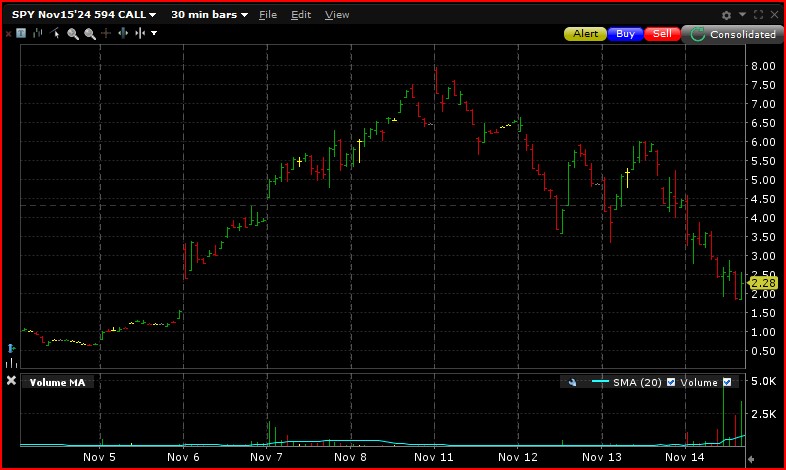
The chart below shows the Nov 15, 2025 SPY 594 call option on November 14, 2024. It is a 30-minute chart and shows that it can easily be traded just like a stock. Each contract represents 100 shares so buying 1 option at 2.28 will cost $228 plus commissions. At the time, the SPY was trading around $592 per share. Option trading done this way gives you a way to participate in trading a very expensive stock. Option trading is good for day or swing trading, likely not longer term trading due to the time premium drop over time.
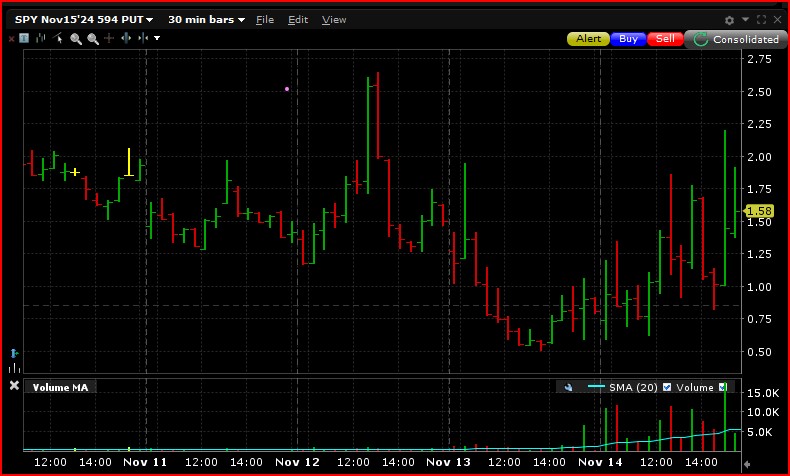
While a call option is easy to trade when the price of the SPY is going up, a put option can be traded when SPY is going down. As a put goes up when the SPY drops you can still be long and make money. Below is the November 15, 2024 294 put on November 14. The call and put option charts here were obtained from Interactive Brokers.
While many traders feel that dealing with options is a risky business, like anything, a bit of education can go a long way to reduce the risk. In theory, if you purchase a good company and things go wrong you can hold it for years hoping that someday it will go up. However, with options this is not the case. All options have an expiry date which is generally any time from the day you bought it up to 9 months after you purchased it. After the expiry date, when the option is out of the money, then it is worthless and you own nothing. Normal options have a maximum expire date of 9 months. To go out further, LEAPS are required.
LEAPS (Long Term Equity Anticipation Securities) are options which have an expiry date longer than 1 year when they are brought to the market.
The basics of option trading
To explain options you need to know that there are two types of options which you can buy – calls and puts. A call option gives you the right to buy a stock at a set price sometime in the future. A put option gives you the right to sell a stock at a set price sometime in the future. From these many different types of strategies can be identified such as covered calls, straddles, spreads, strangles and butterfly strategies. This website will only review buying and selling calls, puts and writing covered calls. If you would like to get a feel for how to write covered calls, please view an actual example of a covered call strategy.
Understanding more about put options and call options will allow you to become more familiar with other option strategies available to you.
Let us look at an example of an option without considering commission charges. On Sept 11, 2024 APP made a large move to the upside (see chart below) and closed at $97.57 with a low a few days earlier of $82.51. The ATR(14) at that time was about $4.00. With a stop at 79.99 the risk on the trade would be $17.58 or 18% which is pretty high. Consider that the November 15 100 call was selling for around $11 the next day. For $1,100 you could buy 1 call or for $9,757 you could buy 100 shares of APP.
On November 14, APP closed at $284.49 for a profit of 1.9 times your initial cost while the option was trading at $188 for a profit of 16x your initial cost. You would have made $18,692 with the stock or $17,700 on the option.
Chart courtesy of Stockcharts.com.
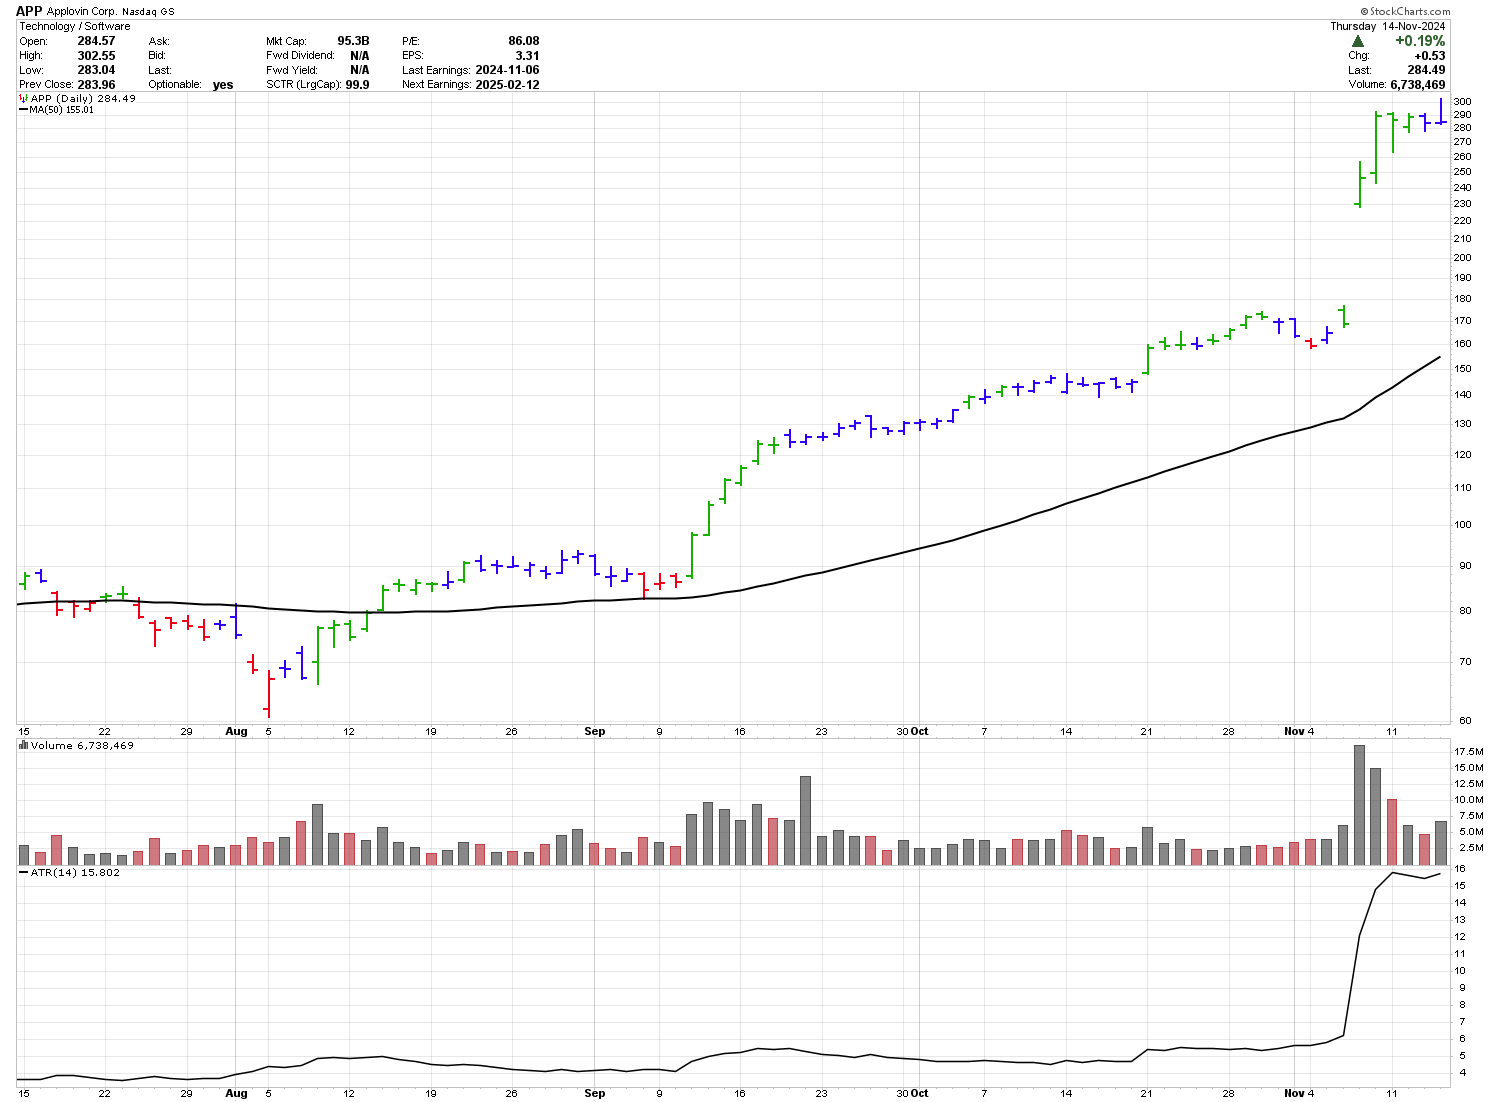
It is clear to see that the option offered much more leverage than the stock and this is the main reason traders like option trading.
But remember, it is stated in many places that the number of options that expire worthless is above 70%. Therefore, you need to understand how to trade options before you become one of the owners of one of the 70% of options which expire worthless.
Our option trading strategies page contains an example of how you can carry out simple option trading strategies which may help you.
The chart below was obtained from TD Waterhouse.
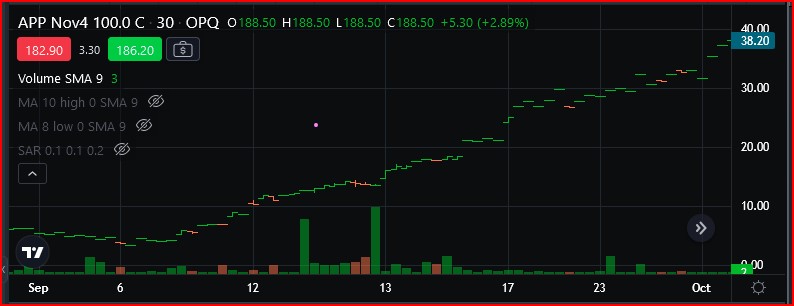
Note that the option above only shows up to early November. When looking at the chart to Nov 14, the buy point is difficult to see. The price of this option was $185 on November 14, 2024.
Gifts for Stock Traders - Stock traders are a different breed. For the stock trader in your life or as a present to yourself consider getting a trading mug. This can be used throughout the day to sip on your favourite beverage and remind you that you are a trader.
Short Course
Introduction on How to Trade Stocks for Beginning Traders
New to trading, not sure where to start. I have put together a short course consisting of 18 lessons. Each lesson should take less than 5 minutes to review. Each lesson provides you with alternate resources to continue learning about that particular topic.
To learn more about this course and sign up please visit the course webpage by clicking the link below.
Monte Carlo Simulator
for Traders
 Having troubles sticking with your trading system?
Do you move from system to system looking for the one system that will bring you riches?
Perhaps you already have it and tossed it aside when it went into a down period.
Using this Excel based program will show you what you can expect out of your trading system once you know the % wins and profit factor.
Stop wasting your time searching for the perfect system (which does not exist) and start trading.
$20.00


