Is Buy and Hold for you?
Buy and hold is more for investors than traders
You may have heard statements like:Buy and hold for the long term. It is time in the market not timing the market that makes you money.
Bulls and bears are used to describe the up and down of the market. A bull tends to use its horns to lift oncoming threats out of
the way and raises them into the air which is the direction of a bull market. Bears
tend to come down on you from above hence they represent a bearish market or
one that is falling.
The above desk figurines depict the back and forth of the market as it unpredictably tends to move in a preferred direction. They make good gifts for traders, stock brokers or financial advisors.
Mutual fund companies sometimes advertise that when you missed the 10 best days during a five year period, your returns would have dropped dramatically. What they do not tell you is that when you missed the 10 worst days of the same five year period, your returns would have increased dramatically.
Holding stocks for long periods of time works great when the companies stock price looks
like Apple's.
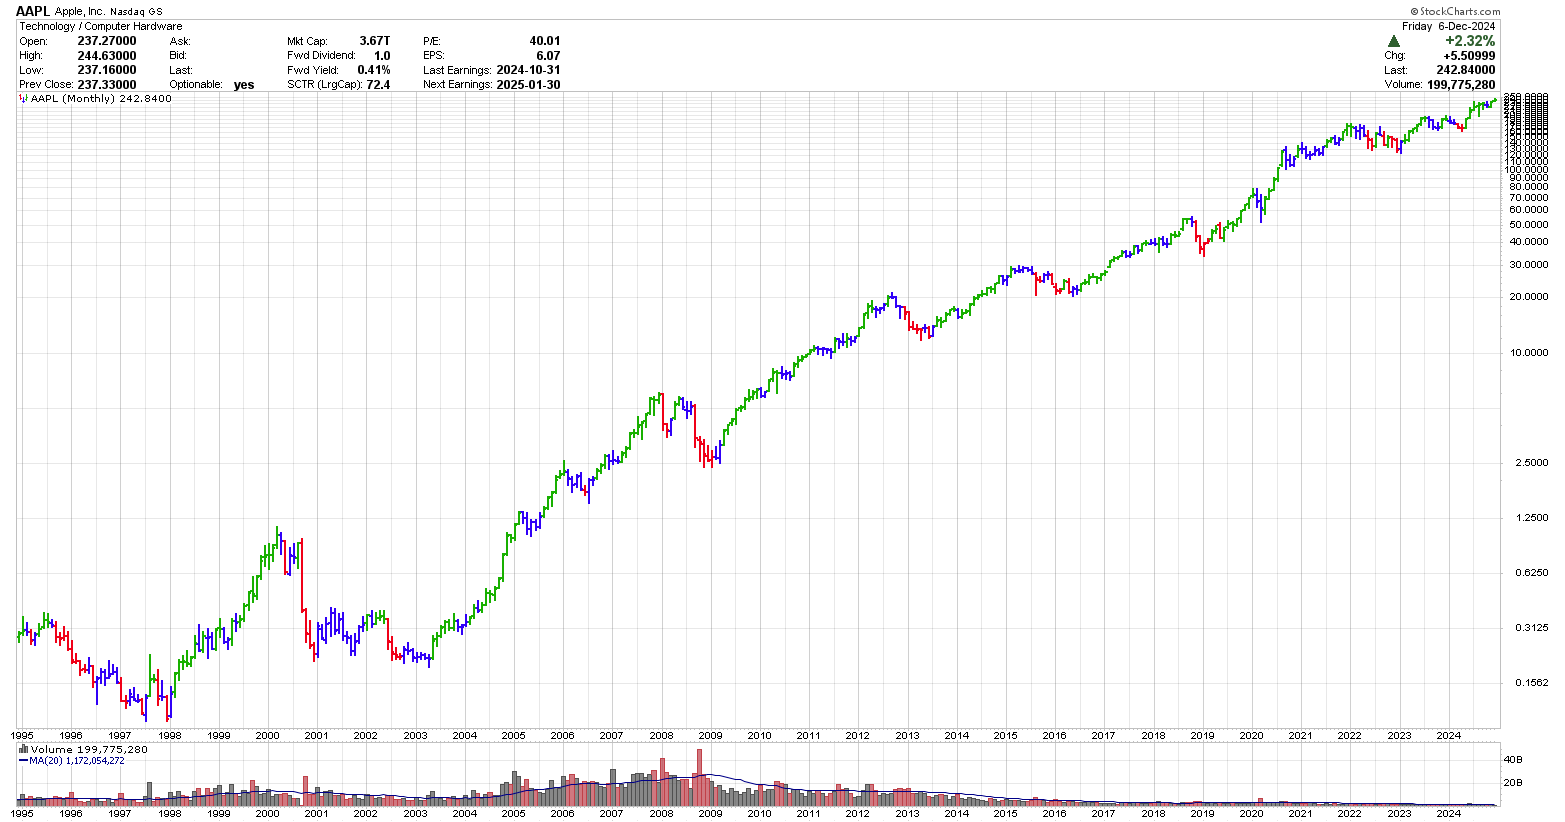
Above is a 30-year monthly stock chart of Apple (AAP). Since the lows seen in 1997, there has
been an increase in AAPL by about 1,600 times. Interesting, I started a 25-year career in the summer of 1997 at which time, AAPL could have been bought for about $17 per share. Since then it has split 112:1. $1,700 in the summer of 1997 would have gotten me 100 shares which would now be 11,200 shares which would have been worth about $2,700,000. Not bad. This one investment could have easily funded my entire retirement. this is the dream of every buy and hold investor
This would have been a great stock to buy and hold. But consider the following:
Chart courtesy of StockCharts.com
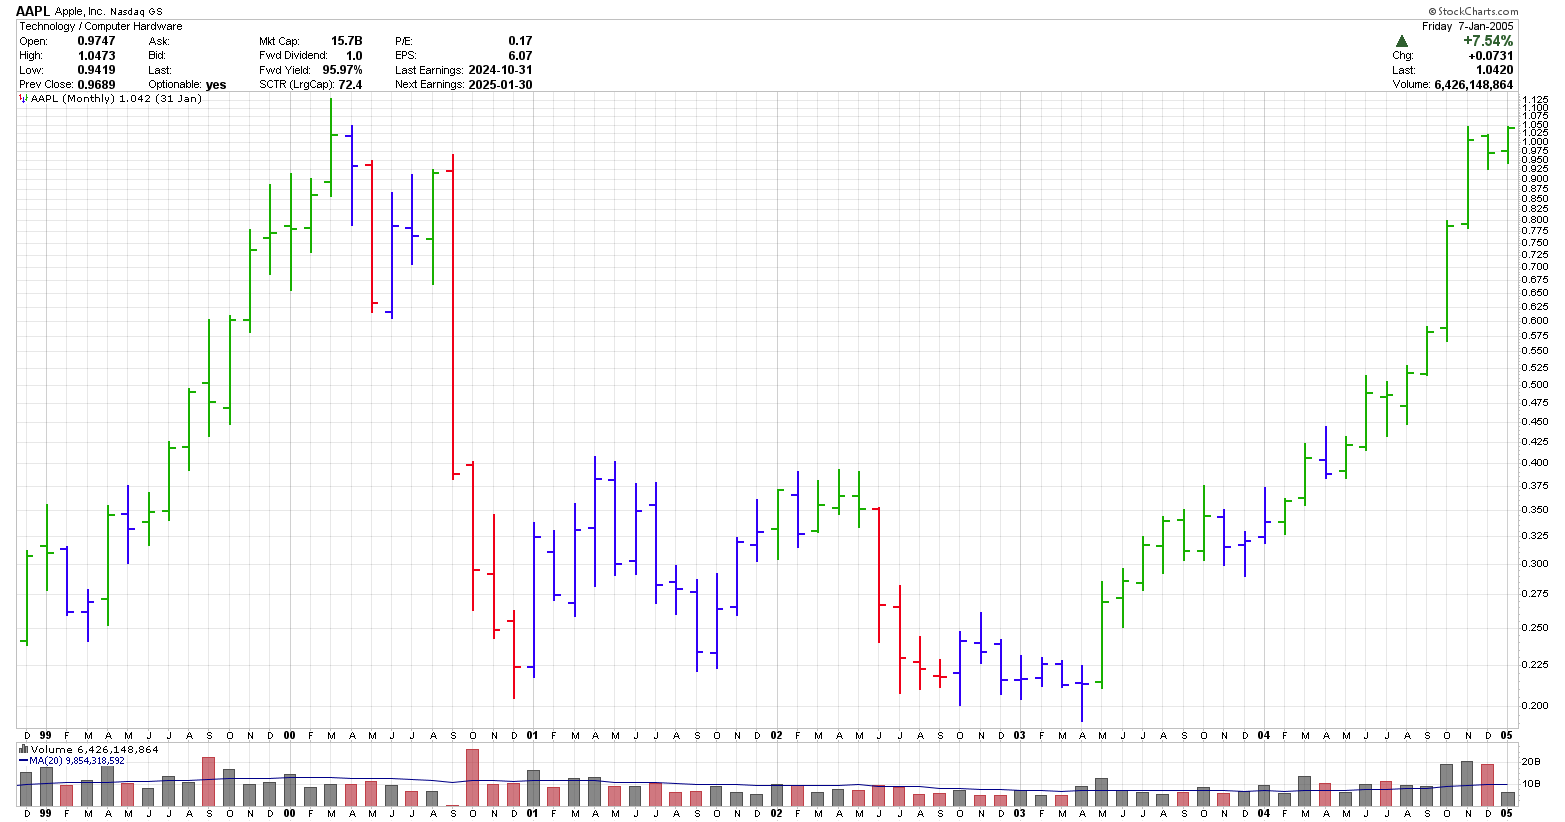
In 2000, AAPL dropped from a split adjusted price of around $1.00 to around $0.20 or 80% in 2003 and essentially went no where for 5 years. You would have gotten back to break even near the end of 2005.
Sitting back now you likely think you would be okay and you could handle an 80% drop in the price and it wouldn't bother you. However, at the time, as other companies went bankrupt it may not have been a pleasant experience.
Then in the financial crisis of 2008, AAPL lost another 60% of it's value. This time, it went no where for 2 years. Another unpleasant experience.
Chart courtesy of StockCharts.com
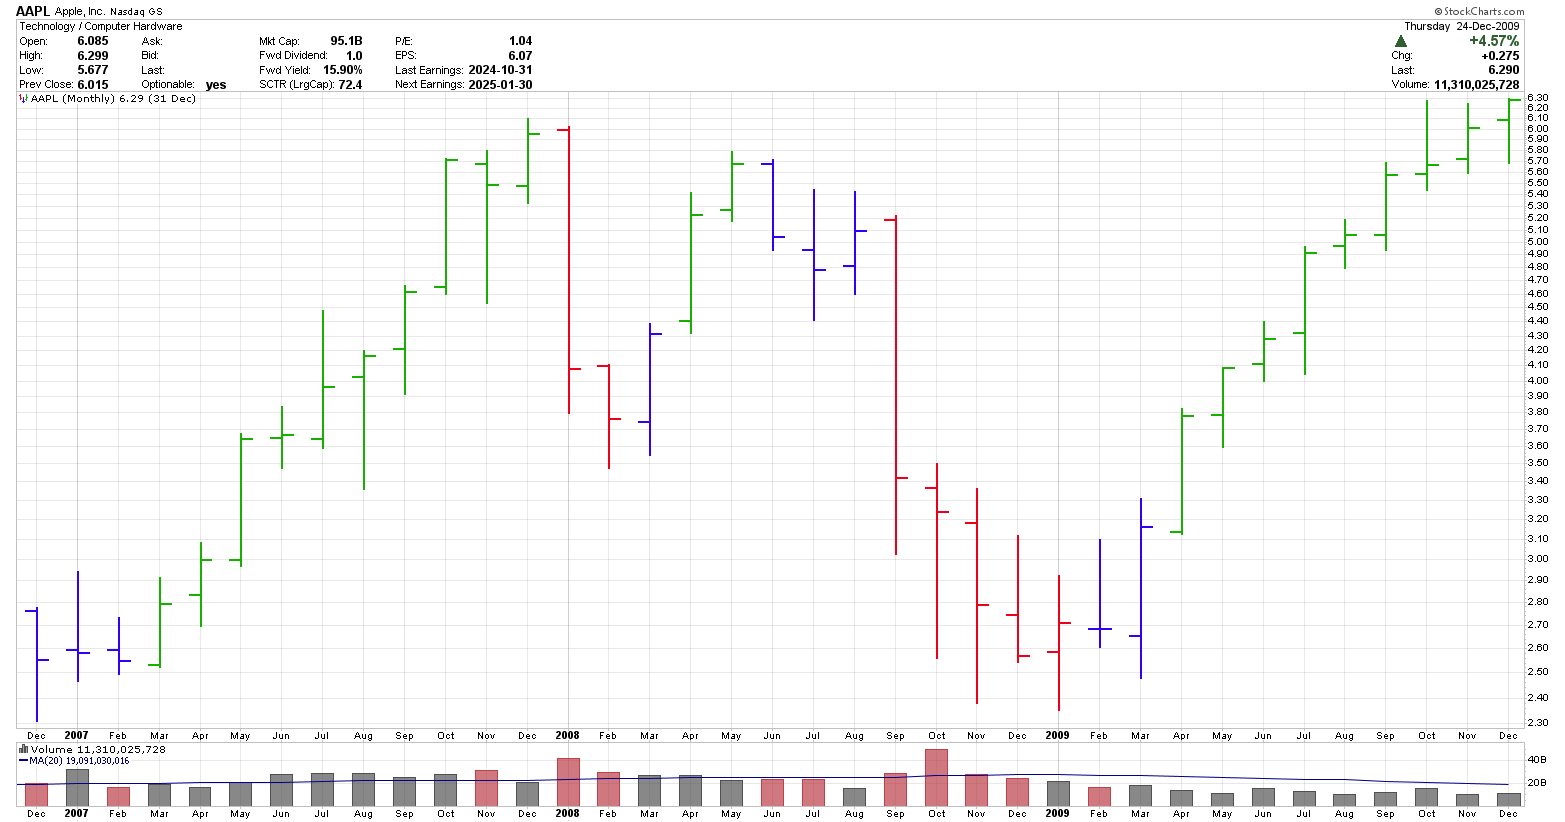
There was another 40% drop in 2012, about a 35% drop in 2018 and a 30% drop in 2020. All of these would have likely caused you to rethink the buy and hold strategy.
While the end result worked out great and made you look like a genius look a the following stocks and how they fared over the last 25 years.
Using the PerfCharts option from StockCharts, which compares the percentage gain of multiple stocks over a certain time period I took a look at Citigroup, Intel, Pfizer, Coca Cola and 3M. All of these companies have been around for a long time and are all large cap companies.
Average vs Great Returns

Chart courtesy of StockCharts.com
Citigroup had the worst record. This 136 billion dollar market cap corporation has dropped about 50% in the last 25 years. The dividend yield on Dec 5, 2024 was 3.1%. Not a great situation when you are planning on using the proceeds of this stock for retirement.
Then
came Intel which is strange as Intel's chips are in many of the
computers we use on a daily basis. In the last 25 years the price has
increased 21%. The dividend yield on Dec 5, 2024 was 2.4%.
Pfizer managed to gain about 25% over the last 25 years. This is a 145 billion dollar market cap company that is paying a dividend of 6.5% as of Dec 5, 2024 so at least you are making a bit of income off of the dividend.
Coca Cola which is a stock that Warren Buffett talked about a lot has done reasonably well since around 1999 increasing approximately 250% and pays a 3.1% dividend.
To round off this series is 3M which has increased about 710% since 1999 and is paying a 2.1% dividend.
When AAPL is put on the same chart, the above 5 stocks just merge with the baseline as AAPL, since 1999, has increased about 5,600%.
How to find the next AAPL
The number of super great companies is quite low compared to the number of companies traded on a daily basis. YCharts has looked into the best performing companies for the past 1,3,5,10 and 25 years.
The above stock charts are based on 25 and 30 years of data. This is a long time for most people and as the charts show, buy and hold does not always work.
The key question to ask would be, why do some companies excel and grow at high rates while others languish. The growth rate from the top 10 companies, with the best 25 year performance, is between 24 to 38% per year averaged over 25 years.
Ultimately, the key answer to what makes these companies so strong has to be back to their fundamentals. They likely have strong brands, good products, strong moats, loyalty, pricing power or other edge that propels them to the top.
The sectors that the top 10 companies came from varied quite a bit so sector does not seem to be that important. They came from:Computer Hardware, Waste & Disposal Services, Footwear, Software, Soft Drinks, Semiconductors, Trucking, Exploration & Production and Specialty Retailers.
I worked backwards to identify the approximate market cap of these companies 25 years ago and they ranged from 30 million to 1.1 billion with one starting out around 8.5 billion. This covers a large range so it would appear that market cap is not that important although there does seem to be a preference to start with smaller cap companies.
By its nature, trading requires action while the buy and hold strategy requires sitting on a position for long periods with the expectation that the share price will appreciate in value. Since trading is active while buy and hold is passive, the buy and hold strategy is really best for investors.
For more information on strategies for investors, look in our section on fundamental analysis where the writers tend to buy and hold more than technical traders.
Gifts for Stock Traders - Stock traders are a different breed. For the stock trader in your life or as a present to yourself consider getting a trading mug. This can be used throughout the day to sip on your favourite beverage and remind you that you are a trader.
Monte Carlo Simulator
for Traders
 Having troubles sticking with your trading system?
Do you move from system to system looking for the one system that will bring you riches?
Perhaps you already have it and tossed it aside when it went into a down period.
Using this Excel based program will show you what you can expect out of your trading system once you know the % wins and profit factor.
Stop wasting your time searching for the perfect system (which does not exist) and start trading.
$20.00

