Compound Interest Show Expected Growth
In the Monte Carlo Simulation software program you will find a compound interest table. This table allows you to quickly see how a specific annual percentage will grow over time. You can look at it two different ways.
In the first table, the value that is returned is a multiplier. It tells you how much your account would have grown by over a specific time period given a specific annual return. As an example, after 10 years at 8% your account will be 2.1589 times as large as it is today.
In the second table, the value in the table has already been
multiplied by the account size. So in
the above example, with a starting account (SA) size of $10,000, the result would
be $21,589.
The compound interest formula is as follows:
Final amount = SA * (1 + (yearly interest rate/100))^number of years
= 10,000* (1.08)^10
=21,589
This is a useful table as it provides you with a very quick estimation of where you need to be depending on your time horizon. Compound interest let's you know how to go from where you are to where you want to be. For instance, if you are 40 years old and have $20,000 saved up you can quickly identify what type of yearly return you will require to achieve the amount of money that you believe you need in 20 years.
Compound Interest Table
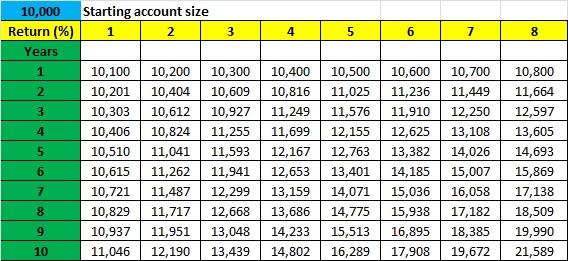
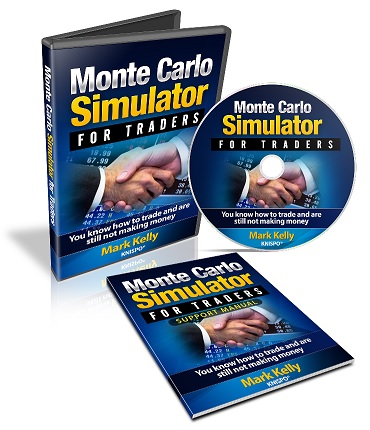
The compound interest table above is expanded in the Monte Carlo Simulator for Traders Excel program It compounds 30 years worth of interest at interest rates from 1 to 30 percent. Considering the best mutual fund managers obtain less than 25% annual return, this table should provide most traders with the information they require.
One also has to remember that the table compounds interest without income tax being paid on the money. Whey you are in a 30% income tax bracket, the real rate of return will be much less than that shown in the table simple due to the payment of income tax.
You can get a copy of the Monte Carlo Simulator program for $20. This program also comes with a Support Manual to help you get the information you require when using it.
Bulls and bears are used to describe the up and down of the market. A bull tends to use its horns to lift oncoming threats out of
the way and raises them into the air which is the direction of a bull market. Bears
tend to come down on you from above hence they represent a bearish market or
one that is falling.
The above desk figurines depict the back and forth of the market as it unpredictably tends to move in a preferred direction. They make good gifts for traders, stock brokers or financial advisors.
Profit Factor and Payoff Ratio
The last worksheet in this Monte Carlo Simulator for Traders looks at a profit factor and payoff ratio. One of the things I found was that the final equity I was getting was not always in line with what I had expected. That turned out to be a result of the amount risked on each trade. For instance, risking 2% of your account vs 1% of your account on a trade, over time makes a huge difference in your final equity.
This of course can be on the positive or negative side.
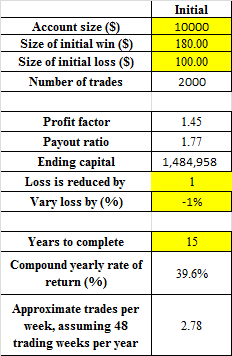
In the program, you can enter any of the numbers
highlighted in yellow. This then
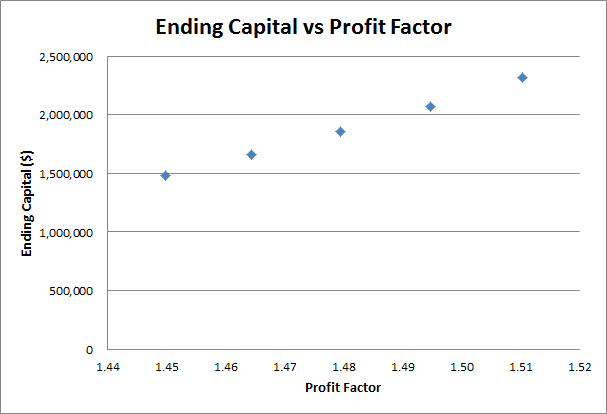
produces a graph which is shown below.
This graph plots a line of ending equity vs the profit factor for the trading system under investigation. It is
just another way to explore your options. You can also compare this back to the compound interest table to compare the difference in interest vs trading income.
In the above discussion, I have attempted to educate you on how a Monte Carlo simulator works. Interested in continuing this education and understanding how you need to accept losses before you can make profits? You can get a copy of this Monte Carlo Simulator for Traders program for $20 and start to put your own numbers in and start to chart your course.
The Monte Carlo Simulator for Traders Program

All of the work has been done for you in the The Monte Carlo Simulator for Traders program which costs $20. The graphs which have been described on this and other pages should be able to help you move to the next level.
You can get a copy of it by following the link below. The link will take you to PayPal and once you have logged into PayPal you can apply any discount coupon you have. Once you have paid for the program, you will be redirected to a web page where you can download the Monte Carlo Simulator for Traders program which is Excel based. I also have a couple of bonuses on this page which you may find interesting.
If you have any questions about the program, please use the Contact me page to send me an email.
When you want to play with a free online Monte Carlo Simulator to get a better visualization of the results, click here.
You can learn more about the Monte Carlo Simulator for Traders by reading other pages on it.
Monte Carlo Simulator for Traders
This page gives a more detailed explanation of the program
This page gives a more detailed explanation of why using a Monte Carlo simulator program can help you and why you see different types of returns when you input the same numbers
How many losses in a row do you think you can handle while trading?
This page talks about the profit factor which is a number you need to know about when developing your trading system
Gifts for Stock Traders - Stock traders are a different breed. For the stock trader in your life or as a present to yourself consider getting a trading mug. This can be used throughout the day to sip on your favourite beverage and remind you that you are a trader.
Monte Carlo Simulator
for Traders
 Having troubles sticking with your trading system?
Do you move from system to system looking for the one system that will bring you riches?
Perhaps you already have it and tossed it aside when it went into a down period.
Using this Excel based program will show you what you can expect out of your trading system once you know the % wins and profit factor.
Stop wasting your time searching for the perfect system (which does not exist) and start trading.
$20.00

