How Many Shares You Buy Can Be Determined By Your Stop Loss Point
How many shares you buy should be based on your money management plan and will depend on the amount of money you are willing to lose on a trade not on how much you want to make.
How Many Shares of a stock can you buy?
Bulls and bears are used to describe the up and down of the market. A bull tends to use its horns to lift oncoming threats out of
the way and raises them into the air which is the direction of a bull market. Bears
tend to come down on you from above hence they represent a bearish market or
one that is falling.
The above desk figurines depict the back and forth of the market as it unpredictably tends to move in a preferred direction. They make good gifts for traders, stock brokers or financial advisors.
Defining your exit strategy before you place your trade is the proper way to identify where to get out of a trade.
Let's assume you have a $50,000 account and can handle, without emotion, a loss of $500 on a trade. This amounts to 1% of your account. While the 1% will stay constant over many trades, the number of shares you purchase will vary depending on the risk on each trade.
Let's look at three examples based on a trade I did on AST.TO back in September of 2024. In this example, I will look at two trades from a 130-minute chart and one trade from a daily chart. The 130-minute chart is shown below and shows some intraday movement yet moves slow enough that trading it it does not take up that much time.
Chart courtesy of StockCharts.com
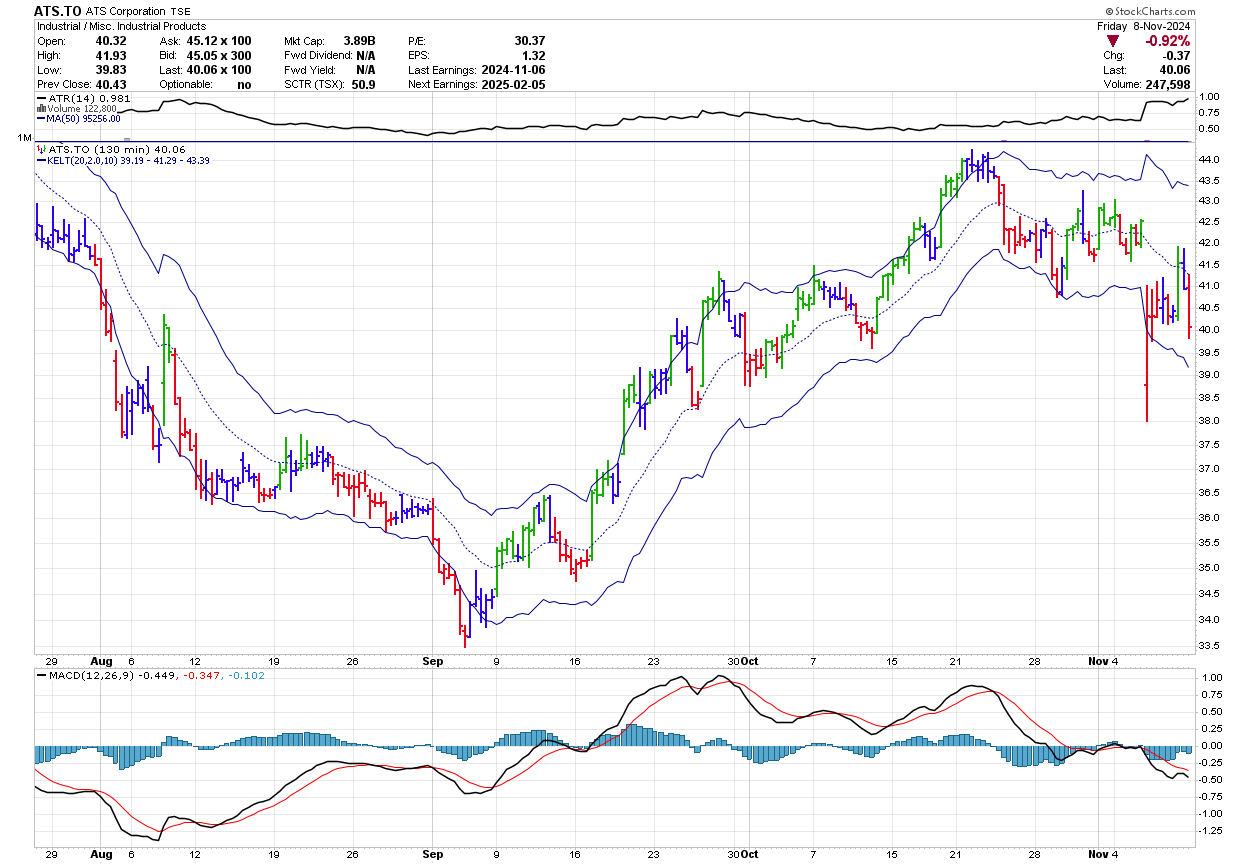
In this case, on September 5, 2024 there was a divergence between price and the MACD histogram and line. Also, the low was below the Keltner Channel for a number of bars suggesting an oversold condition. The low ($33.47) on that day was a new low however, the MACD histogram and line were higher than they were back in early August.
In this case, you note that price made a high ($34.96) before receding. On September 9, you see that a higher high will be made so you place a buy on stop (BoS) at $35.01. You decide that you want a tight stop so you place your stop loss at $33.44 which is only 3 cents away from the low.
The argument here, for this stop, is that when this is truly the low, price will not go below $33.47. Thus, the risk on the trade is $1.57 (35.01 - 33.44). Since you are willing to risk $500 per trade you decide to buy 300 shares. While the actual number of shares would be 318, I prefer to buy round lots however you could buy 318 or 310 when you prefer to do this.
You move your stop loss up to just under each inflection point low as price rises and on November 6 get stopped out at the open at $38.79 as you had a stop loss in just under the low on October 29 at $40.69
This is a good example of what can happen in the markets. The large drop was due to the US Presidential results on November 5 and instead of getting out at the stop price of $40.69 slippage in the order of $1.90 occured resulting in reduced profits to the tune of $570.
Profit on this trade was $1,134 before commission. The reward to risk was around 2.4:1.
After the trade is over, it is easy to see where you should have gotten out yet following a specific plan for every trade generally is a better bet. In this case, the stop was moved up after each new high was reached to the next obvious inflection point. For some traders, they may have drawn a trend line along the lows and exited the position around $41.50 on the trendline break. In hindsight, this was the better option.
Now consider the same trade as above except that you decide that the markets can be a bit chaotic at times and you want your stop at one ATR(10) below the low which would be at $32.97 which increases the risk to $2.07. How many shares can you now buy? In this case, with a higher risk, you would reduce the number of shares you buy and you would purchase 240 shares.
Following the same plan as above you would exit at 38.79 for a profit of $907 for a reward to risk of 1.8.
Chart courtesy of StockCharts.com
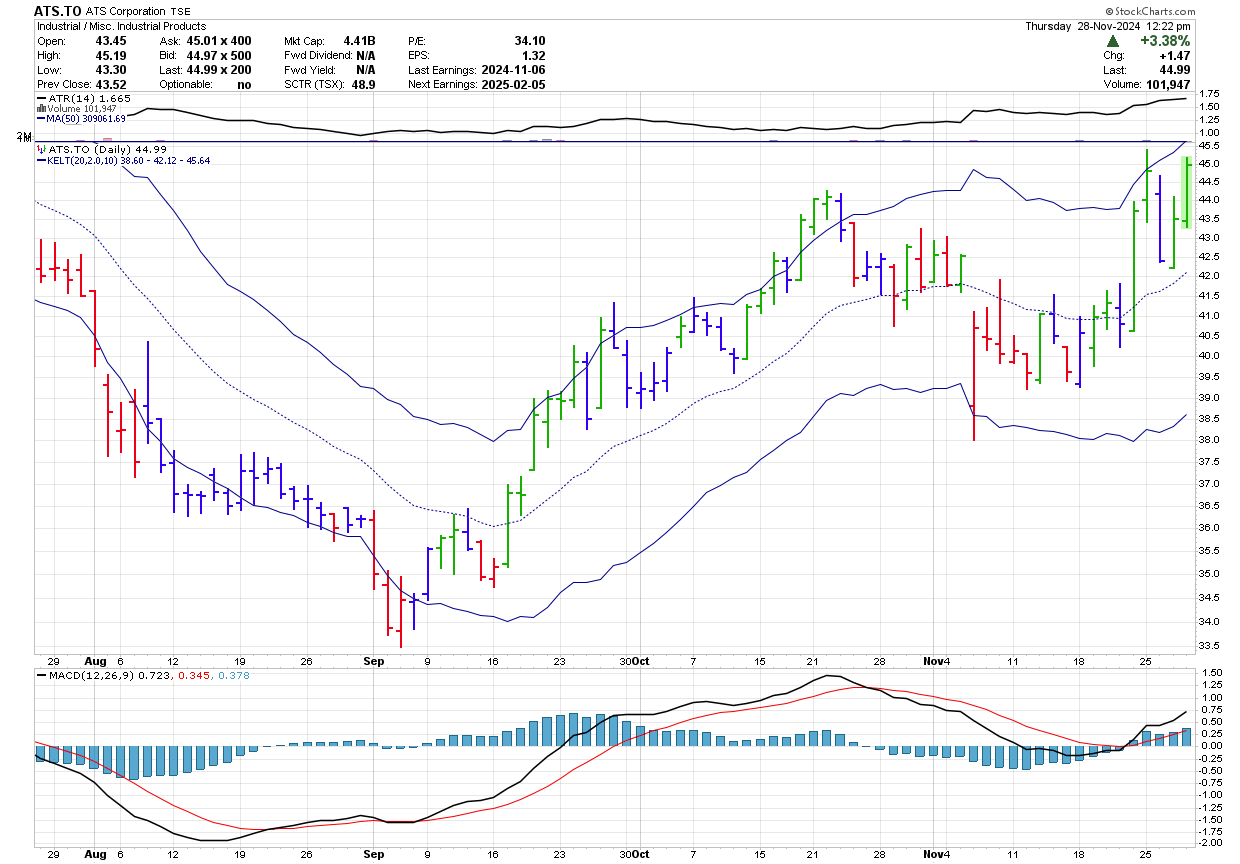
Now let's consider a similar trade on a daily chart. The set up is the same as there is a divergence on the daily as well. In this case, the higher high does not occur until September 17 and the buy price is $36.51 with a stop at $33.44 for a risk of $3.07. In this case, you will buy 160 shares and the profit will be $364.80 without commissions. Here the reward to risk is now down to 0.74:1.
From the above examples you can see that as the risk increases, the number of shares is reduce while keeping the risked amount approximately the same in every trade.
You can see that once you have set your risk tolerance, it is your sell stop that determines the number of shares you can buy.
To learn more about how many shares to buy you may want to read Alexander Elder's "Come Into My Trading Room".
Gifts for Stock Traders - Stock traders are a different breed. For the stock trader in your life or as a present to yourself consider getting a trading mug. This can be used throughout the day to sip on your favourite beverage and remind you that you are a trader.
Monte Carlo Simulator
for Traders
 Having troubles sticking with your trading system?
Do you move from system to system looking for the one system that will bring you riches?
Perhaps you already have it and tossed it aside when it went into a down period.
Using this Excel based program will show you what you can expect out of your trading system once you know the % wins and profit factor.
Stop wasting your time searching for the perfect system (which does not exist) and start trading.
$20.00

