Profit Factor and the Payoff Ratio
Two numbers which you should know about
You will need a profit factor, which is the
payoff ratio multiplied by the % winners and divided by the % losers, will need to be
greater than one in order to make money in the markets. The equation is written as follows:
Profit Factor = Payoff ratio x (% winners) / (% losers)
The payoff ratio is the average amount won on a winning trade divided by the average amount lost on a losing trade. So that looks like this:
Payoff ratio = (average $ won by winners) / average $ lost
by losers)
There are a couple of ways you can come up with the percent winners and the payoff ratio. You can manually back test an idea using at least 50 and preferably a hundred trades and then calculate these numbers. I’ve done this in the pass and it can be long and laborious work and it is also very dependent on your ability to be honest.
To do this correctly, you need to follow your rules exactly as written in order
to determine the correct results. You
also need to cover bullish, bearish and range bound markets, unless your system clearly states to avoid these types of markets.
The other way is to buy back testing software, code the back test and run it on the markets you are interested in. There are lots of software programs out there that do back testing. Some do an extremely good job of it and others are more basic in nature. I am currently using AmiBroker and am quite happy with it.
The Payoff Ratio
In the Monte Carlo Simulator for Traders, you will find curve (blue line below) showing the break even payoff ratio for trading systems which win between 30 to 60% of the time. Said another
way, the blue line represents a profit factor of 1. You can adjust the blue line to give you any profit factor (red line). This red line in the example below, represents a profit factor of 1.2.
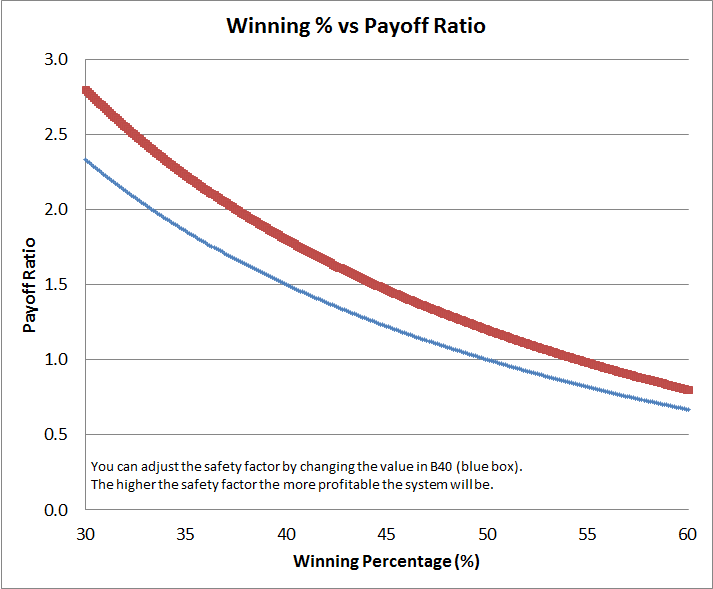
Depending on your mindset, will depend on how you adjust the red line. The beauty of this curve is that everything on the line has the same profit factor and is therefore comparable. The only difference is the number of losses in a row you are required to accept.
You may find yourself in a position where you like the final profit that a system delivers yet you are unwilling to accept the number of losses in a row. For instance, when after five losses in a row, you start to feel yourself getting out of control then you have two choices, the first is you can find a method that has a higher probability of a win or you can improve your ability to take a loss.
In the Monte Carlo Simulator for Traders Excel based program you can adjust the profit factor and quickly identify equivalency. This downloadable software package comes with a Support Manual and costs $20.
Profit Factor and Drawdowns
Once you determine a winning percentage and profit factor that will work for you, you can use these numbers to quickly calculate a number of hypothetical equity curves.
Since you only know an approximate probability of a win going forward you’re never quite sure what to expect in the future. Yes, in the past your system delivered 50% but as they always say, past performance is no indication of future performance.
Using this Monte Carlo Simulator for Traders software
package will give you a
at least a rough idea of what to expect going forward. The graph below shows a system which wins approximately 45% of the time. In this case, the black line won 45.75% of the time and resulted in a final equity of about $2,200,000. The blue line demonstrates a winning percentage of 43.65% and a final equity of around $650,000.

The smooth orange line in the above graph represents a theoretical curve for a system with a winning
percentage of 45%. This curve is designed to give a smooth an equity curve as
possible so the wins and losses are placed in a pattern. The theoretical line is approximate and can be out by 0.1 to 0.3% but is close enough to give you an idea of where your final equity should end up.
Generally, the 10 simulations that are done within the program will be above and below this smoothed theoretical curve. This is because a random number generator is used to determine when the trade will win or lose. Since random number generators are not exact, when you indicate to the system that your winning percentage is 45% you can expect, over 2000 trades, that the simulator will typically average somewhere between 42 and 48% winning trades. This range makes a very large difference in the ending results and this is why you’ll see a huge difference between the best and worst performing simulations.
The End Game
Trading is all about probabilities. You have to develop a probability mindset and you have to realize that no matter how good your system is, no matter how good the setup is there is always a probability that you are wrong. When you cannot accept this then you should probably not trade. By using this Monte Carlo Simulator for Traders software package you can get a much better idea on whether you want to start putting your money at risk or want to spend a bit more time developing your system.
Monte Carlo Simulator for Traders

The Monte Carlo Simulator for Traders program costs $20 and can be paid for using PayPal. Once finished on PayPal you will be redirected to a web page where you can download the program. I have also included a couple of bonuses for you which you may find interesting.
If you have any questions about the program, please use our Contact me page to send me an email.
Bulls and bears are used to describe the up and down of the market. A bull tends to use its horns to lift oncoming threats out of
the way and raises them into the air which is the direction of a bull market. Bears
tend to come down on you from above hence they represent a bearish market or
one that is falling.
The above desk figurines depict the back and forth of the market as it unpredictably tends to move in a preferred direction. They make good gifts for traders, stock brokers or financial advisors.
You can learn more about the Monte Carlo Simulator for Traders by reading other pages on it.
This page talks about losses and why you need to understand them
Monte Carlo Simulator for Traders
This page gives a more detailed explanation of the program
This page details the compound interest table and how to use it
Monte Carlo Simulation
This page gives a more detailed explanation of why using a Monte Carlo simulator program can help you and why you see different types of returns when you input the same numbers
Gifts for Stock Traders - Stock traders are a different breed. For the stock trader in your life or as a present to yourself consider getting a trading mug. This can be used throughout the day to sip on your favourite beverage and remind you that you are a trader.
Monte Carlo Simulator
for Traders
 Having troubles sticking with your trading system?
Do you move from system to system looking for the one system that will bring you riches?
Perhaps you already have it and tossed it aside when it went into a down period.
Using this Excel based program will show you what you can expect out of your trading system once you know the % wins and profit factor.
Stop wasting your time searching for the perfect system (which does not exist) and start trading.
$20.00

