Stock Market Timing
When to buy a stock is obvious after it goes up
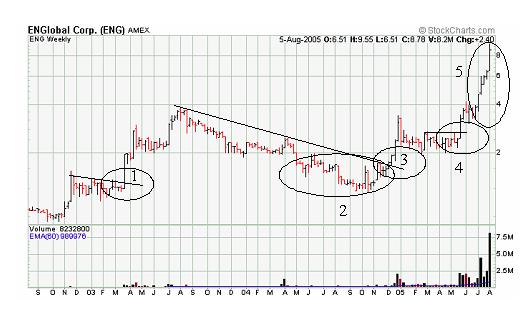
The type of stock market timing signals you use typically depends on what type of trader you are. For example, let us look at five entering signals identified on the three year chart of ENGlobal Corp. (ENG, now ENGC) below.
Bulls and bears are used to describe the up and down of the market. A bull tends to use its horns to lift oncoming threats out of
the way and raises them into the air which is the direction of a bull market. Bears
tend to come down on you from above hence they represent a bearish market or
one that is falling.
The above desk figurines depict the back and forth of the market as it unpredictably tends to move in a preferred direction. They make good gifts for traders, stock brokers or financial advisors.
Chart courtesy of StockCharts.com

The Trades
- A swing or position trader may use the breakout of the trend line as an indicator to acquire the stock;
- A value investor may acquire the stock sometime during this period;
- A swing or position trader may acquire the stock on the breakout signal from the trend line;
- A swing or position trader may acquire the stock on the breakout of the trend line;
- A momentum trader may have purchased during this very quick rise.
Provided you sold at the correct time, you could have made money in all of these trades as any of these types of stock traders.
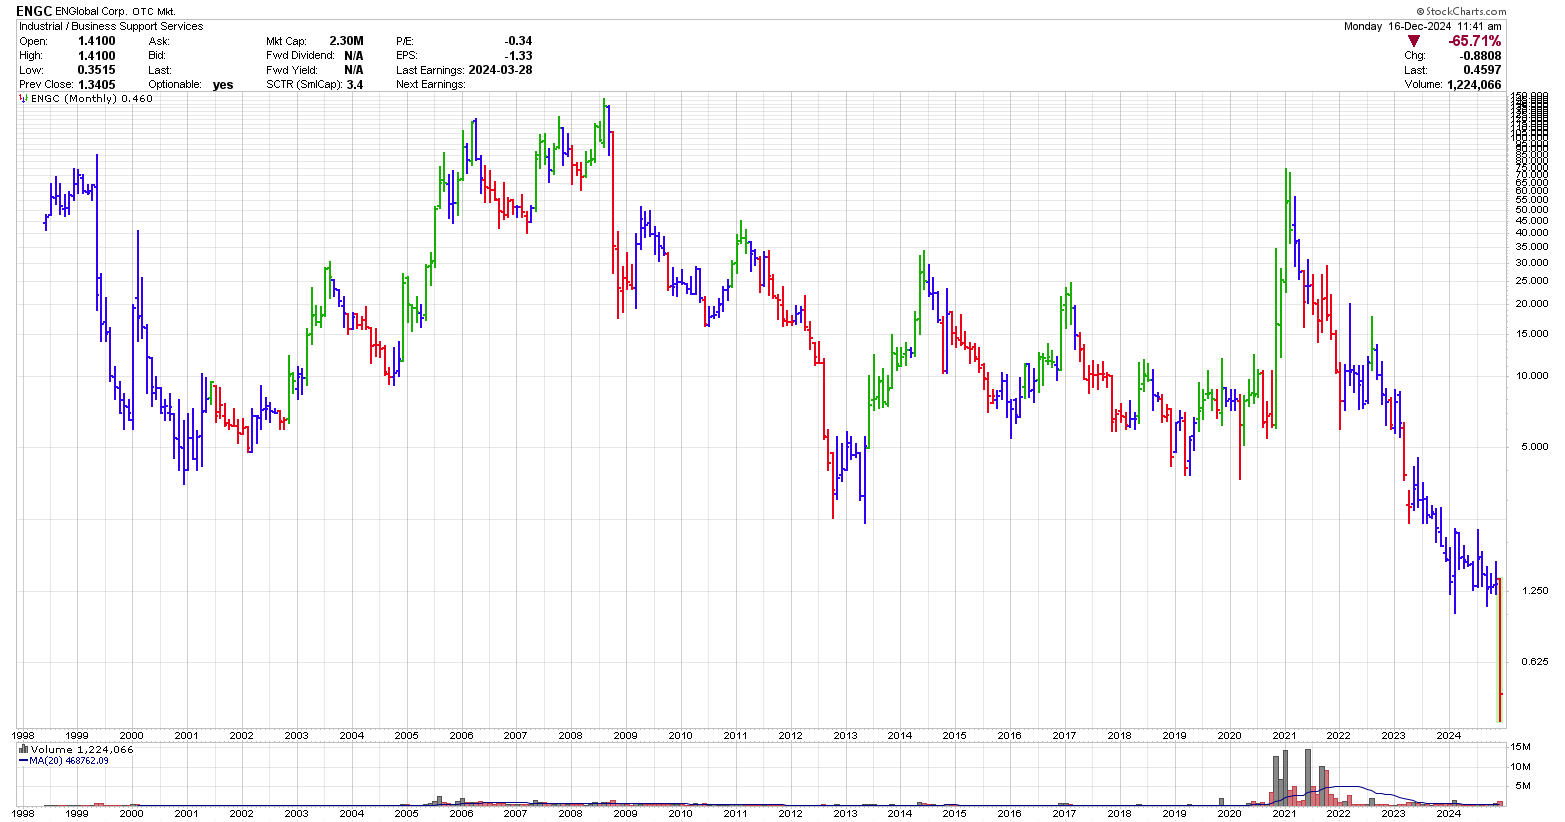
Interesting, when I look back on the above trades it is apparent that a long term hold of ENGC was a bad idea for any buy and hold traders/investors. The trade initiated at the end of 2004 increased approximately 6x the initial price which would have been a great trade. Then after 2 years price started to weaken. At the end of 2023 the stock consolidated (8 old shares for 1 new share). At the end of 2024 with a market capitalization of 2.3 million it appears that ENGC has had better days.

Charts courtesy of StockCharts.com
Some of the ways traders time the stock market are by looking at the business cycle, using various trading signals such as the number of new lows or new highs, by following timing indicators such as moving average crossovers or other indicators and by looking at chart patterns.
You could also follow a tried and true saying, "The trend is your friend." Simply put, as a beginning trader, you should not acquire stocks in a downtrend. The back end of the saying is "Until it is not".
Stock Market Timing Example

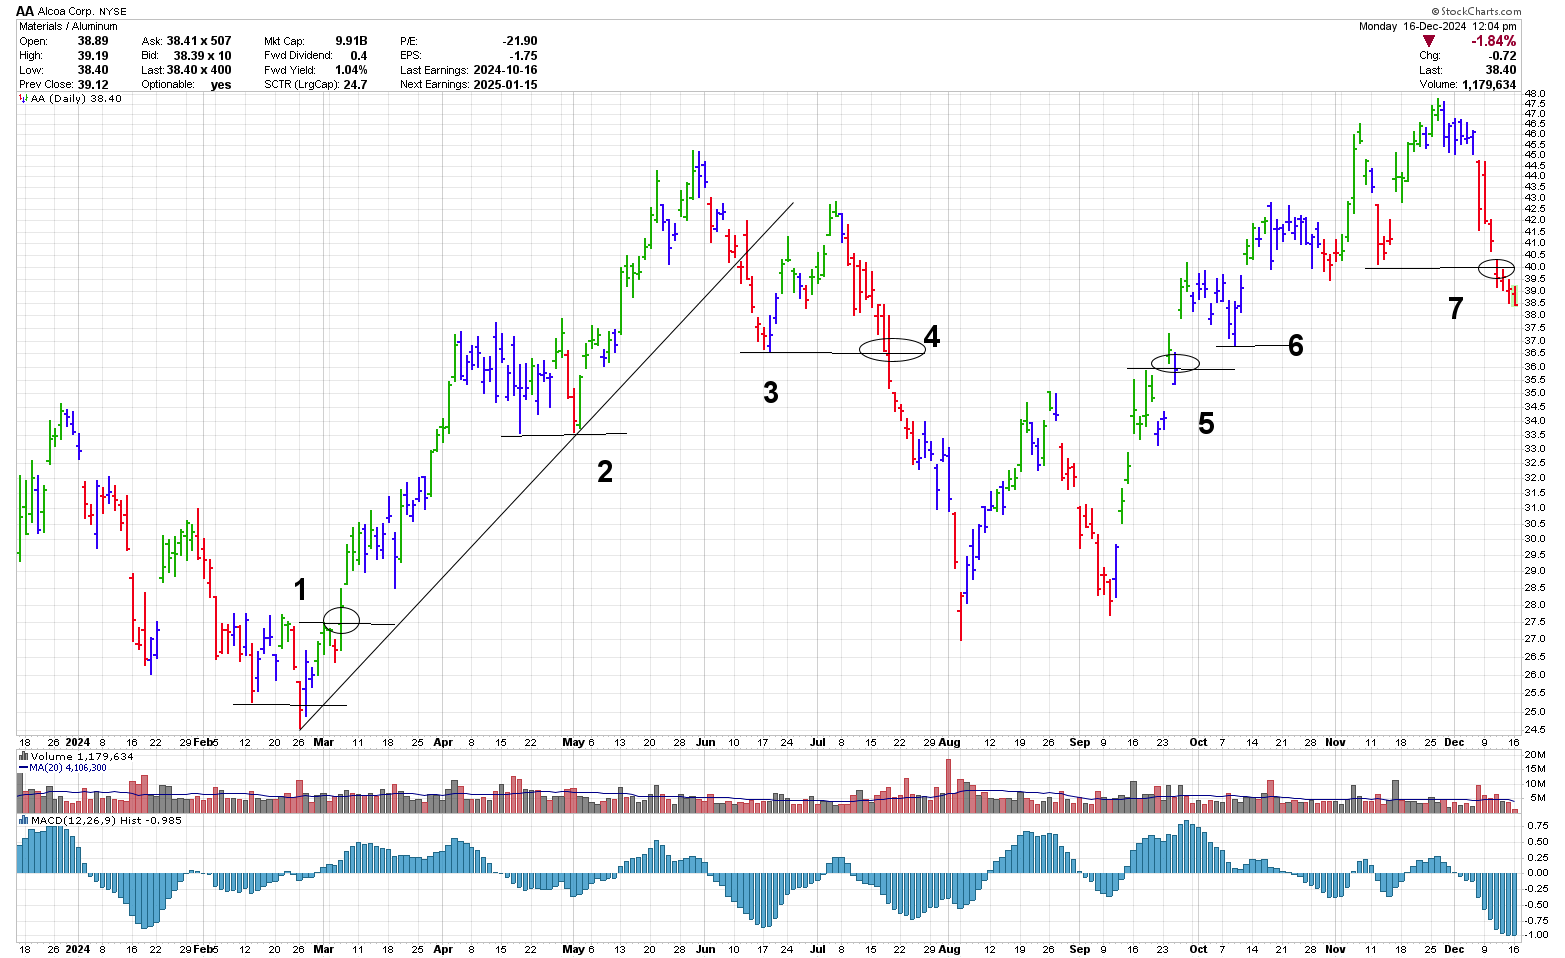
Consider the daily stock chart of Alcoa (AA) during 2024. I picked AA simply because it's a large corporation and starts with AA. In 2024, AA demonstrates a number of trades that show good stock market timing. It's always easier to see these stock trading examples after the fact.
Starting with a divergence as shown by the MACD histogram in late February, as described in Elder's book, "The New Trading for a Living", a higher high could have been purchased around $27.50. Provided the trader continued to move up their stop to the last inflection point after a new high was reached, the traders stop would eventually be approximately where points #2 is.
Around early June, the trader may have noticed that a trend line break was occurring and sell at around $40 on June10.
Alternately, the trader could have left their stop in at point #2 waited for the cycle low and then saw a higher high in early July. At this point they would have been happy and been thinking a newer high was about to occur.
Around July 6, the trader may have noted that a higher high, which was seen the week previous, had now been eradicated and replaced with a small trendline break to the downside.
At this point, considering the information available, the trader could have done one of two things:
- Move the stop up to point #3
- Sold on the trendline break around July 10, 2024.
For option #1, once their stop was at point #3, the position would've been sold on July 19 as it broke below the low achieved on July 18.
When the trader was only a long only trader they would then be out of the market and wait for another buy signal.
However when the trader also was willing to short the market or purchase a put, this could have been done on the same day they exited the long position because a lower low was reached at point #4.
While short at around $36 produced $10 profit there was really no way to get out of this trade using a daily timeframe. Dropping down to a intraday time frame would likely have identified a reasonable area to exit the trade in early August, especially when one held puts on AA.
The next potential trade could have been at point #5. The first higher high was seen on September 16 however the risk on this trade is quite large and it doesn't really make too much sense to enter at this point.
Waiting a few days produces a much better risk reward situation and buying AA after it broke above the high of September 18 with an exit below the low on September 21 would've been a reasonable trade.
Once in the trade, the trader could have moved up their stop loss price up to point #6 in and continued to move it up until it reached point #7. Here, the trader would've ended up selling on December 11. Initiating a short at this point point seems relatively risky and likely would not been taken.
To learn more about stock market timing and ways to enter the market, including divergence methods read Alexander Elder's book, The New Trading for a Living. In it, he details on page 229 how to find divergence trades similar to the one shown above.
While many people
believe that stock market timing is critical to their success as a
trader, according to Van K. Tharp in Technical Analysis of Stocks and
Commodities, April 1999, page 76 he stated that a traders system
only accounts for about 30% of their success. To learn more about
stock market timing keep up with the latest developments in these reviewed magazines.
Gifts for Stock Traders - Stock traders are a different breed. For the stock trader in your life or as a present to yourself consider getting a trading mug. This can be used throughout the day to sip on your favourite beverage and remind you that you are a trader.
Monte Carlo Simulator
for Traders
 Having troubles sticking with your trading system?
Do you move from system to system looking for the one system that will bring you riches?
Perhaps you already have it and tossed it aside when it went into a down period.
Using this Excel based program will show you what you can expect out of your trading system once you know the % wins and profit factor.
Stop wasting your time searching for the perfect system (which does not exist) and start trading.
$20.00


