A Stock Screener Finds Opportunity
Stock Screener - Technical or fundamental information?
Before you begin looking for a stock screener, you need to know what type of trading or investing you do. Will you be searching for stocks based solely on technical or fundamental data or are you looking at some combination of both?
Bulls and bears are used to describe the up and down of the market. A bull tends to use its horns to lift oncoming threats out of
the way and raises them into the air which is the direction of a bull market. Bears
tend to come down on you from above hence they represent a bearish market or
one that is falling.
The above desk figurines depict the back and forth of the market as it unpredictably tends to move in a preferred direction. They make good gifts for traders, stock brokers or financial advisors.

A common stock screener finds stocks using either technical analysis or fundamental data. VectorVest, which is paid service, offers a combination of both technical and fundamental analysis. A stock trader generally would screen stocks using technical data while an investor can use either technical, fundamental data or a combination of both.
It is quite common for stock traders to use fundamental analysis to narrow down the types of stocks they want to trade. Also, some investors will use technical analysis to help them identify a good buying point once they have identified a stock meeting their fundamental requirements.
If you are not sure of the differences between the two types of searching methods the following may help.
Some examples of technical analysis screens are:
- Moving average crossovers
- New one year highs
- Closing at the high for the day
- Breakouts from overhead resistance
- MACD divergence
- Volume expansions
- Specific chart patterns
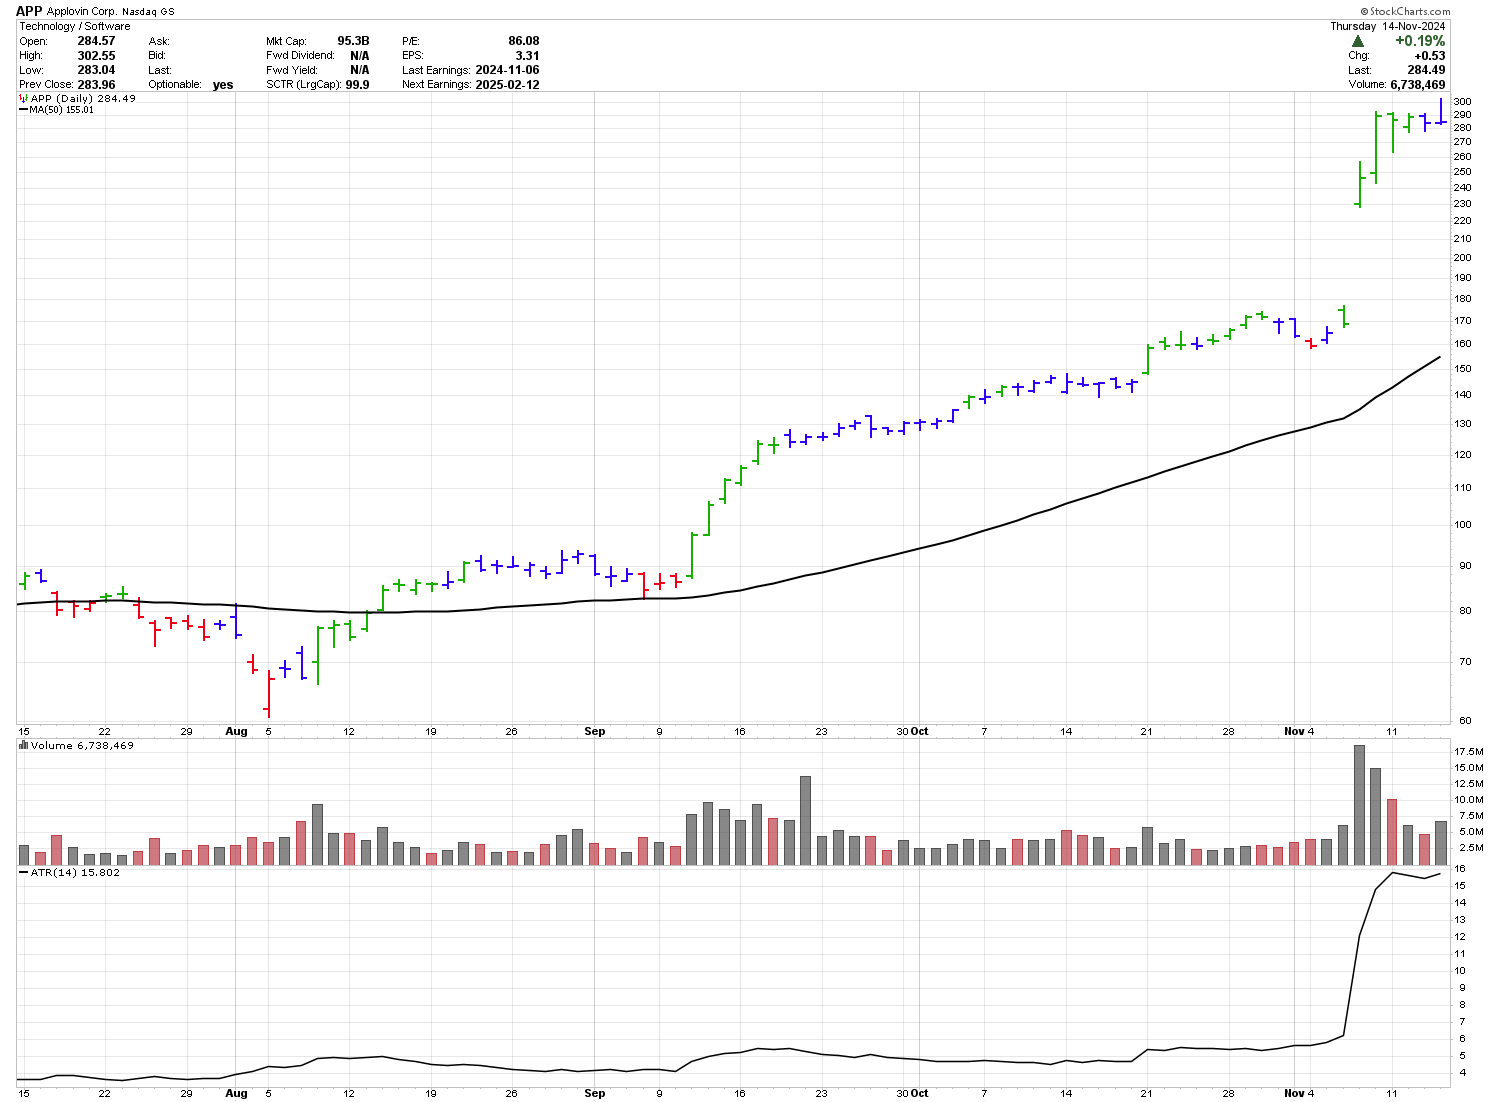
Consider the stock chart of APP above in which a new high was made on September 11, 2024. Just searching for new highs, you will find a lot of stocks to examine and this takes a lot of time. However, by going to StockFetcher you can click on the +Create New Filter at the top right and add the code below to find stocks that hit a new 2 week high with volume above 1,000,000.
By entering the code below the number of stocks meeting this code are quite low which makes it a lot easier to narrow down the number of stocks which you will need to review. As an example, on Dec 6, 2024 I found 2 examples from the above code. While in StockCharts there were 760 new 52 week highs found. Which would you prefer to look at? To use this stock screener for penny stocks just change the price from 1 and 100 to 1 and 5 or less.
Close is between 1 and 100
and average volume(20) is above 1000000
and volume is above 1000000
and close is above the SMA(50)
and Volume is above volume 1 day ago
close is above open
close reached a new 1 month high
high / 2 week low < 1.5
Consider what happens to the number of stocks found when specific lines are removed from the above code.
high / 2 week low < 1.5
50 stocks
close reached a new 1 month high
233 stocks
close is above open
608 stocks
and Volume is above volume 1 day ago
1278 stocks found
Fundamental analysis for Stocks
One of the better websites to screen stocks for fundamental analysis is Finvis. This website provides most of the main fundamental screening criteria and can be easily used to reduce the number of stocks you are following to ones which have long term potential. For instance, this is a good stock screener for dividends. Using this screen allows you the comfort of knowing the stocks you are trading are fundamentally sound.
Fundamental criteria you may consider could be:
- Low p/e
- Trading below book value
- Increased earnings
- Improving margin
- Increasing sales
- Low debt to equity
- Steadily increasing dividends
- A good moat which makes entry difficult
- Dividends
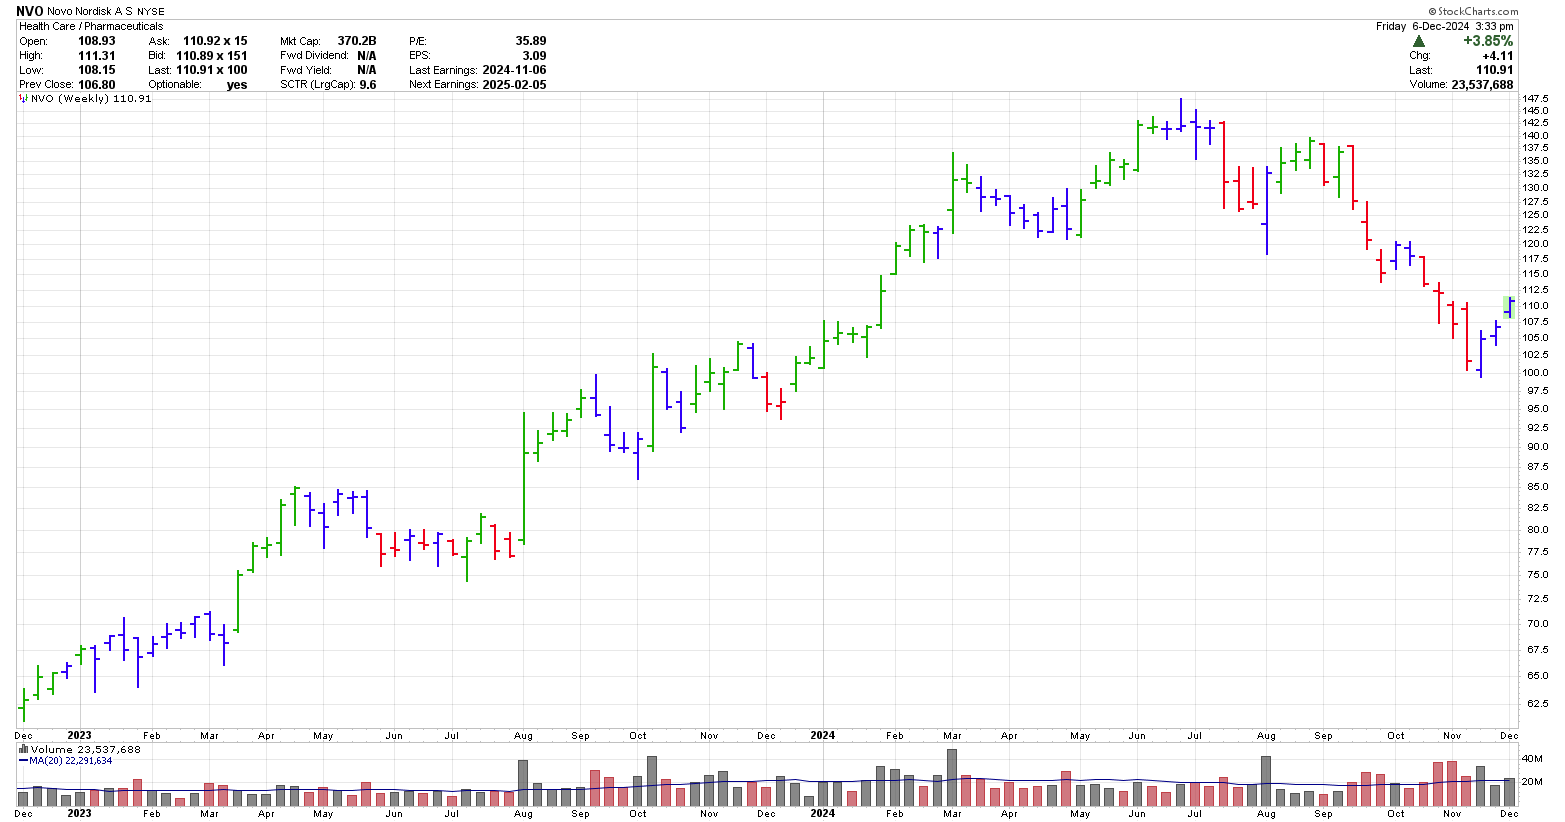
The challenge with fundamental analysis and scans revolves around timing and what to look for in a stock. When would you buy either of the two stocks shown below. Both pass the requirements for companies which have a wide moat.
Looking at the two of them from a technical perspective, they both could be good entry points. FIVE is breaking out on good volume and has a higher high.
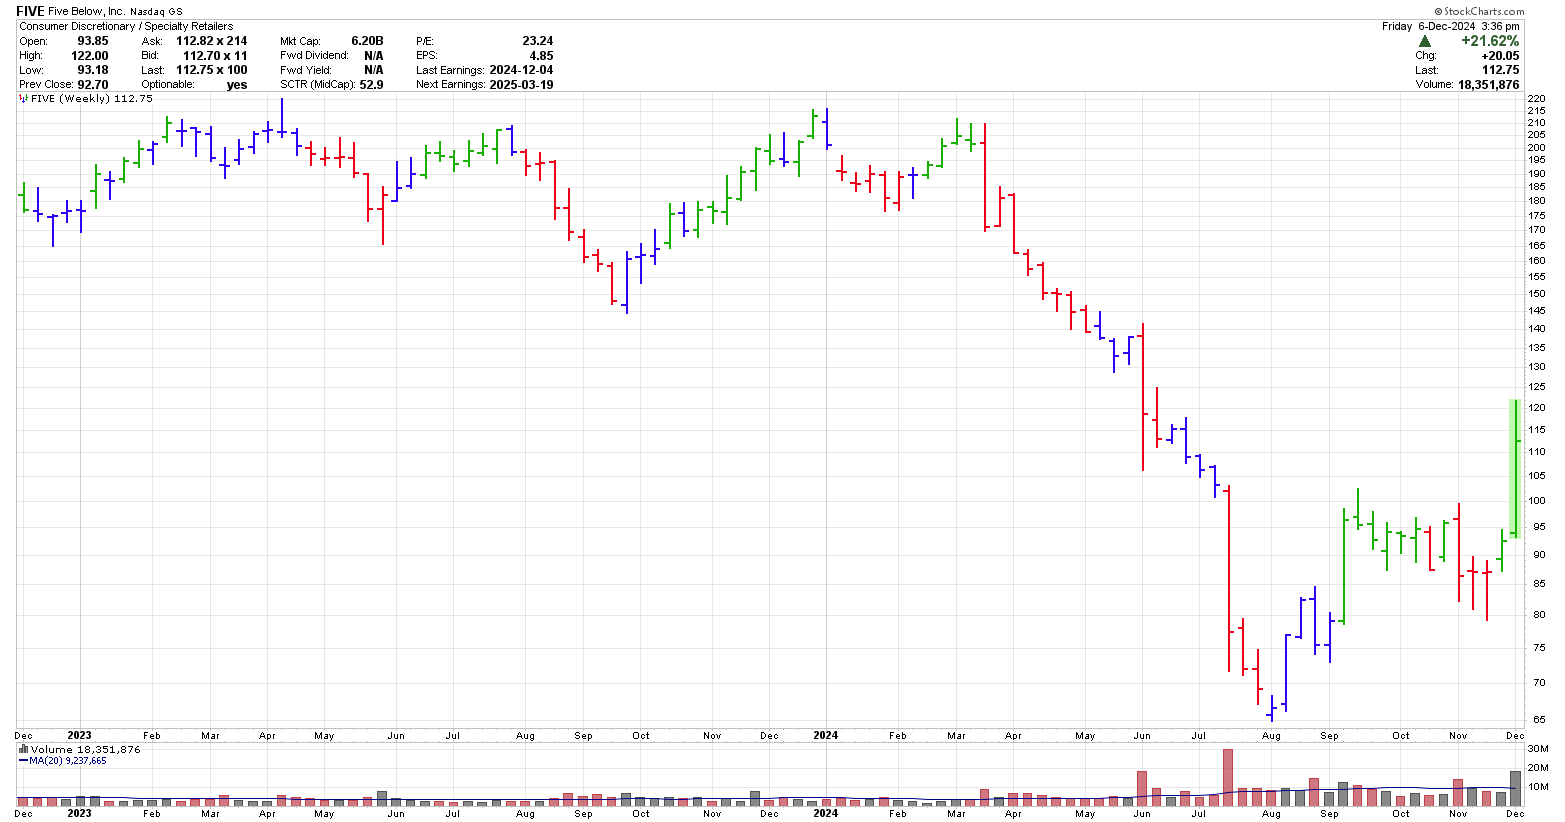
NVO has just come off of a divergence on a daily chart. Is this a great time to buy, or is this just a bit of a correction in a coming down trend?
The exit point on NVO looks a lot less risky.
With fundamental analysis, many of the experts in this area, would not have an exit point. Their end game is selling 5 to 10 years from now. This takes a specific type of person to sit through large drops.
There are many websites which feature free stock screeners. Check them out and learn which one works for you before you subscribe to any of the fee based ones.
Ultimately, the best website for screening for you will suit your trading style and your lifestyle. For example, some common screeners search all US and Canadian markets at the same time while others search only one exchange at a time. Also, their output is different and you may not like the format or ease of use of some of them. Finally, many of the free screeners offer paid services as well. Generally, with a paid service you get better data, more information, better timing, easier formatting and improved education.
Gifts for Stock Traders - Stock traders are a different breed. For the stock trader in your life or as a present to yourself consider getting a trading mug. This can be used throughout the day to sip on your favourite beverage and remind you that you are a trader.
Monte Carlo Simulator
for Traders
 Having troubles sticking with your trading system?
Do you move from system to system looking for the one system that will bring you riches?
Perhaps you already have it and tossed it aside when it went into a down period.
Using this Excel based program will show you what you can expect out of your trading system once you know the % wins and profit factor.
Stop wasting your time searching for the perfect system (which does not exist) and start trading.
$20.00

