The stock trader in you can vary depending on the trade
A stock trader may use different accounts for different styles of trading
The type of stock trader you are will determine the time frame you trade, when you will buy and sell as well as influencing which stocks you will buy. Once you become familiar with trading, most people can carry positions as either a day, swing or position trader. Some may also find situations in which it pays to be an investor.
Bulls and bears are used to describe the up and down of the market. A bull tends to use its horns to lift oncoming threats out of
the way and raises them into the air which is the direction of a bull market. Bears
tend to come down on you from above hence they represent a bearish market or
one that is falling.
The above desk figurines depict the back and forth of the market as it unpredictably tends to move in a preferred direction. They make good gifts for traders, stock brokers or financial advisors.

Let us divide the trading world into four different types of traders and give them the following definitions:
Scalper
- Holds stocks for seconds to minutes
- Buys 1000's of shares but only makes a couple of cents per trade
- Is looking for the difference between the bid and asked to make a profit
- Could trade more than 100 times a day
- Needs extremely good data
- Requires very good emotional control
- Needs high volume stocks to easily get in and out of the market
Day trader
- Holds stocks for minutes to hours
- Uses intraday charts to make buying or selling decisions
- Needs real time data
- Is looking for large intraday moves
- Could trade more than 10 times a day
- Needs strict risk control strategies
- Requires good emotional control
- Likely trades off of 1 to 15 minute charts
Day Trade Example
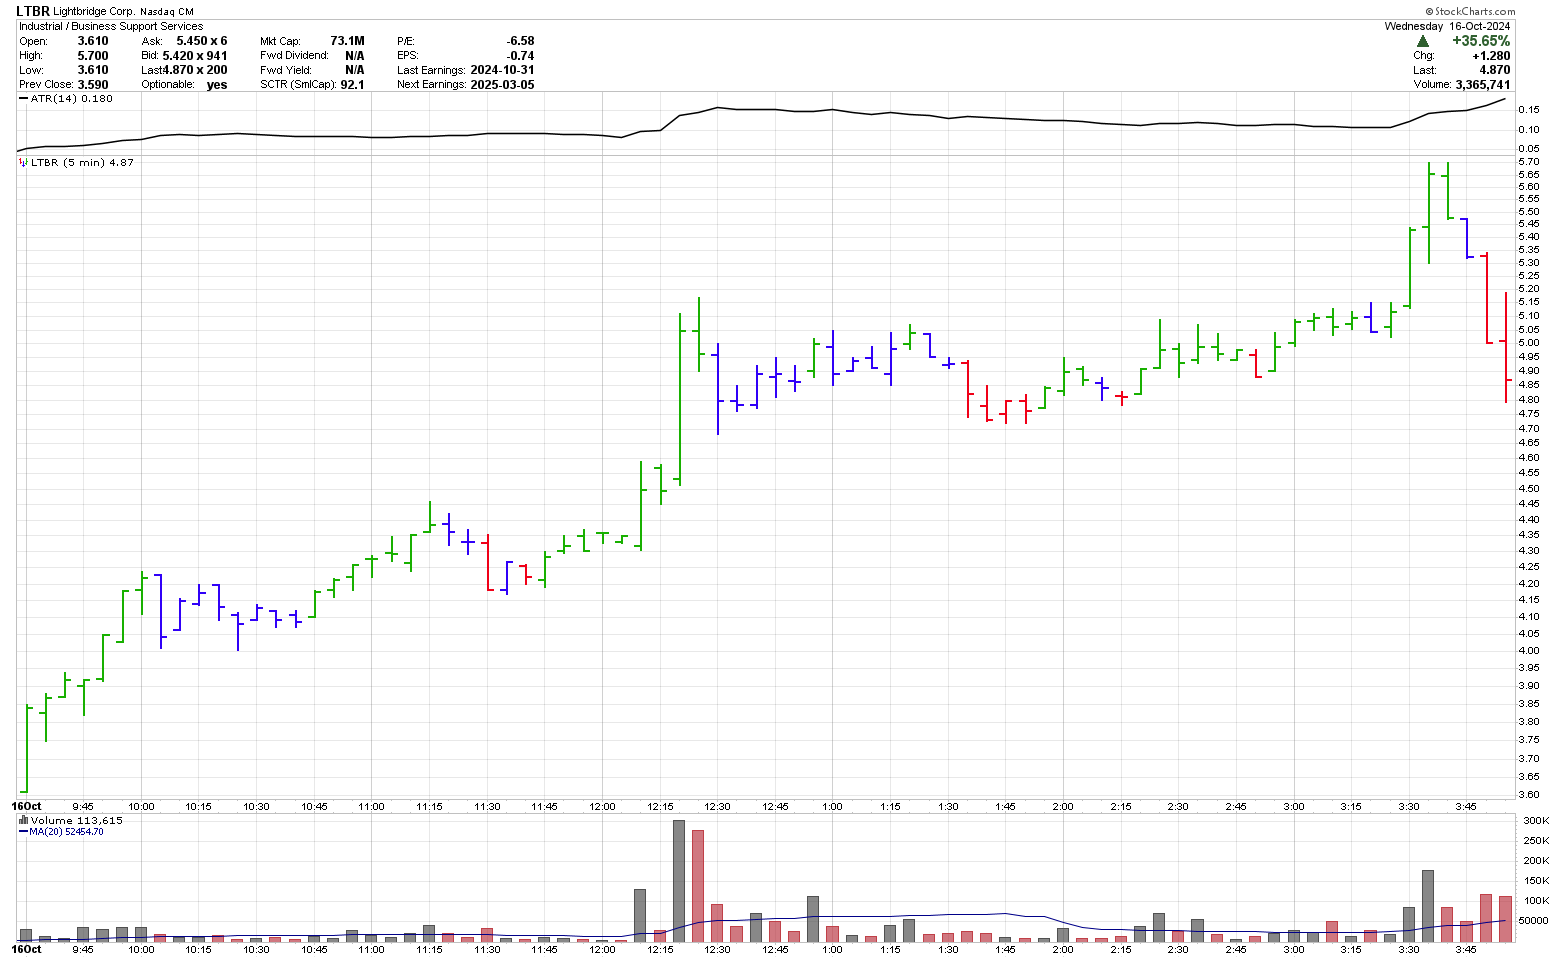
The three charts on this web page are various trades which a trader could have done on Lightbridge Corp. (LTBR) beginning on October 3, 2024. Some day traders follow a limited number of stocks and just trade those stocks. Others scan the market for opportunities that present themselves. A good source of information on scanning for abnormal activity in the stock market can be found on Stockscores.com and in Tyler's book The Mindlesss Investor.
Monitoring the market on October 16, 2024 at 12:10, the higher volume and new high may have caught a day traders eye. Buying at the close of the bar at $4.50, a stop loss could have been entered at $4.24 which is just under the lows for the last 5 bars. With a risk of 0.26, the trader decides to sell 1/3 of the position at 5.02 (2x risk) which is hit 10 minutes later. The stop is then brought up to break even.
As the stock advances, the stop is continually moved up to the last inflection point. Near the end of the day, the trader sells another 1/3 at $5.54 which is 4x the risk. With only 20 minutes left to go in the day, the trader begins to place the stop just below the low of second last bar. In this case, the remaining 1/3 is sold at $5.29.
This example should give you an idea on how a day trader might have traded this stock.
Chart courtesy of StockCharts.com
Swing trader
- Holds stocks for days to weeks
- Could trade more than 10 times a week
- Could use intraday or daily charts to make buying decisions
- When using intraday charts is likely trading off of 15 to 130 minute charts
- Is looking to catch the next swing move
- Needs risk control strategies
- Should be using real time data
- In some cases, when the trend is strong, the trade could last 2 to 3 months
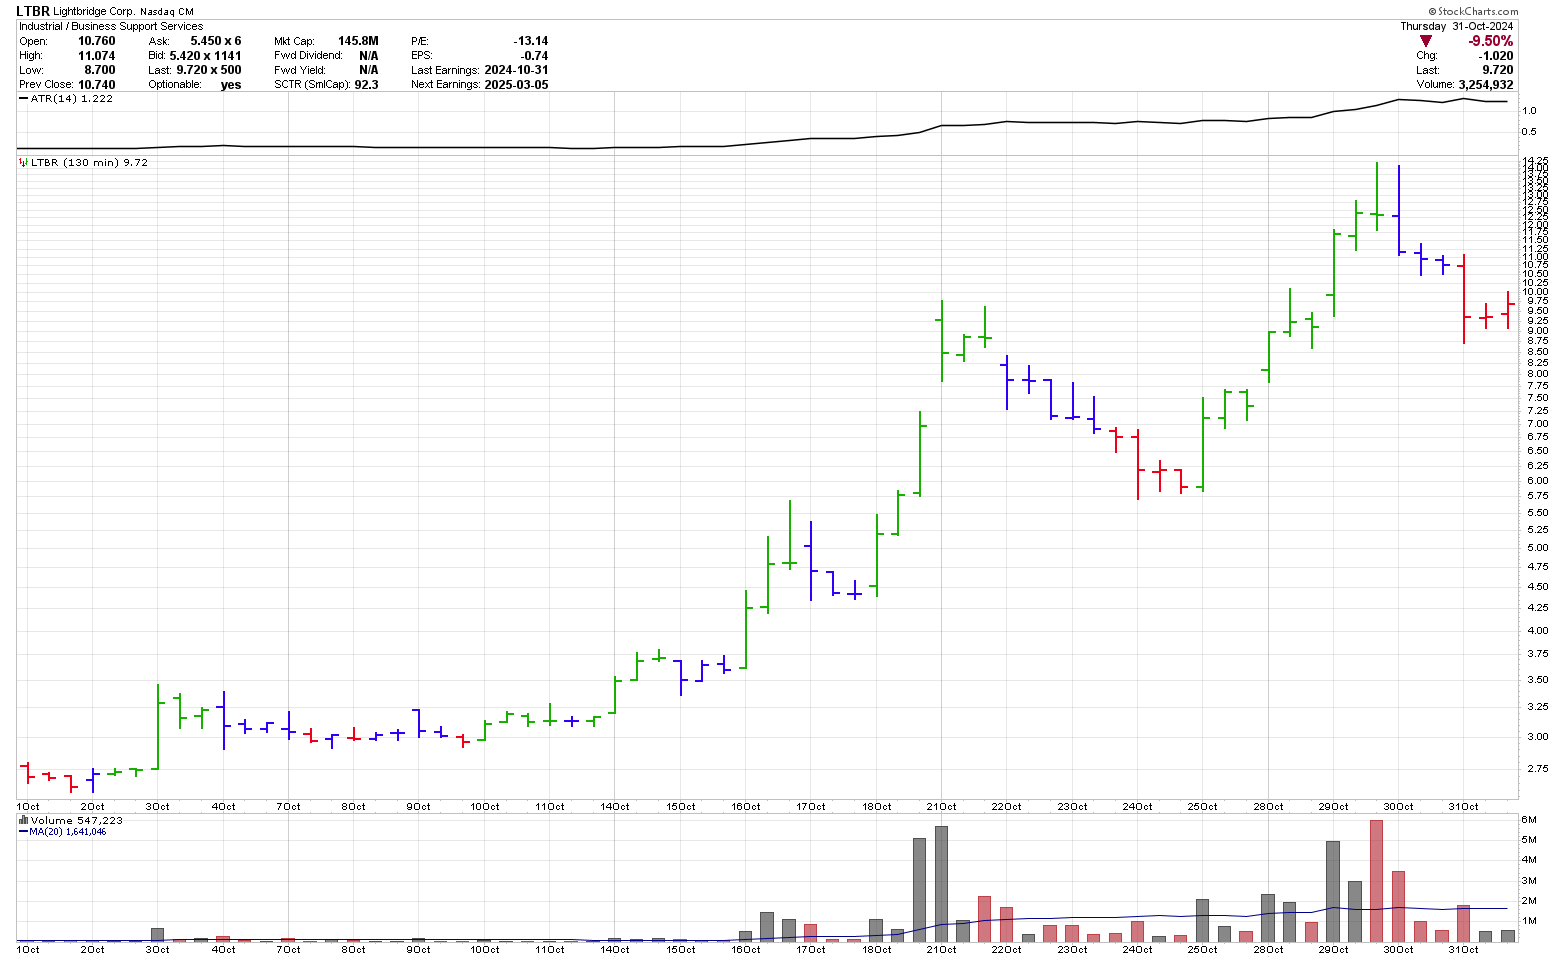
In this example, the swing trader is using the 130-minute bars to trade. Scanning the market at 11:30 on October 3, 2024, the trader sees that LTBR has moved up significantly on good volume. The price was quite calm prior to this move so the swing trader buys at the close at ($3.27) with a stop at $2.49 risking $0.78. The trader then sits on the stock until October 14 when another new high close occurs. As above, the trader decides to sell 1/3 at 2x the risk ($4.83) and take the SPT at $6.39. By Oct 16 only the last 1/3 of the position is left.
The trader observes the large gap on Oct 21 and also notices that price is starting to go parabolic so a stop loss is placed $0.50 (aboaut 1 ATR the bar before) below the low of the opening bar at $7.29 and is stopped out of the trade on October 22.
Chart courtesy of StockCharts.com
Position trader
- Holds stocks for weeks to months
- Does not trade that often
- Uses daily or weekly charts to make buying decisions
- Is looking for large moves over a long period
- Needs risk control strategies
- Can use either live or end of day data
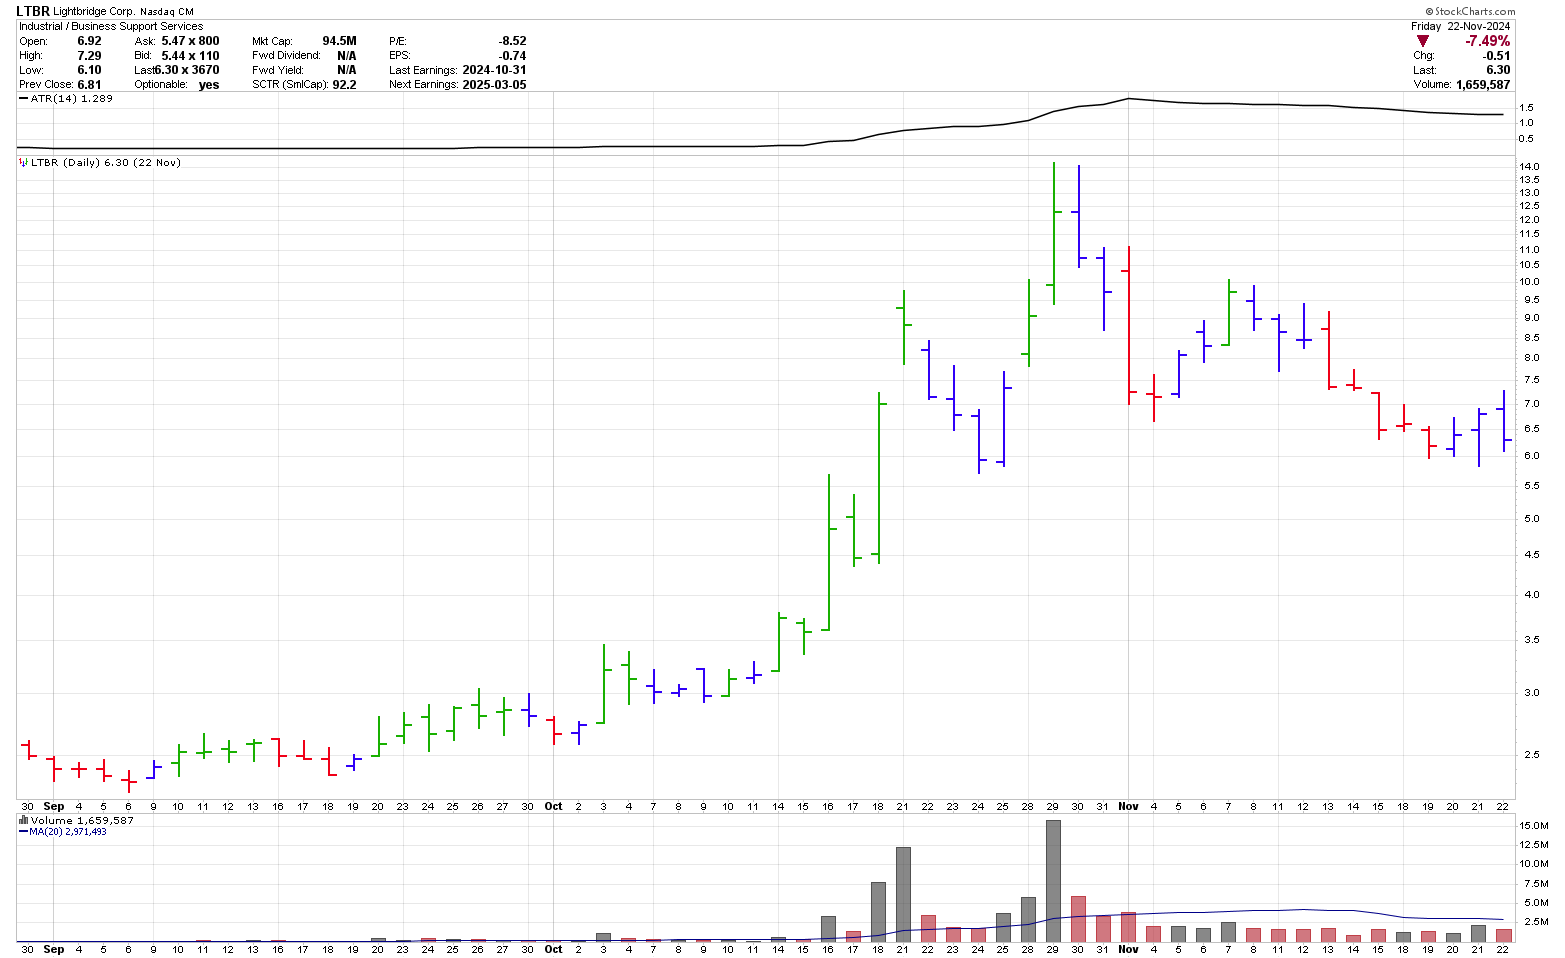
In this example, a position trader sees the new high close on October 3 and buys a the open the next day at $3.26 with a stop loss at $2.49 risking 0.77. As above, the trader decides to sell 1/3 at 2x the risk
($4.80) and take the SPT at $6.34. By Oct 16 only the last 1/3 of the
position is left. A stop is put in at $4.39. When a new high is reached on October 29, the stop is moved to just below the low of October 24. In early November, the trades sees that a lower low may be forming and moves the stop to $6.49, just below the low on November 4 and is taken out of the trade on November 15.
Chart courtesy of StockCharts.com
Investor
The next level is an investor. Investors are not traders but some people who are traders may think they are investors.
- Holds stocks for months to years
- Uses daily or weekly charts to make buying decisions, although many may not use charts at all
- Likely buys or sells less than 10 stocks a year
- Is looking for large moves over a long time period
- Spends a lot of time researching stocks prior to making any buying or selling decisions
- Likely sells when the fundamentals change
- Could prefer dividend growth stocks
One of the qualities required for all of the above types of traders is discipline. It does not matter what type of stock trader you are, all stock traders require discipline. Without will-power, your trading journey could be a rough one.
Gifts for Stock Traders - Stock traders are a different breed. For the stock trader in your life or as a present to yourself consider getting a trading mug. This can be used throughout the day to sip on your favourite beverage and remind you that you are a trader.
Monte Carlo Simulator
for Traders
 Having troubles sticking with your trading system?
Do you move from system to system looking for the one system that will bring you riches?
Perhaps you already have it and tossed it aside when it went into a down period.
Using this Excel based program will show you what you can expect out of your trading system once you know the % wins and profit factor.
Stop wasting your time searching for the perfect system (which does not exist) and start trading.
$20.00

