Stockfetcher has a Scanning and Charting Capabilities
Stockfetcher was My Preferred Online Stock Screener
StockFetcher is a web based, end of day US stock screener. Looking for a specific pattern to trade? You can easily program this online screener to find just about any pattern you can think of.
Bulls and bears are used to describe the up and down of the market. A bull tends to use its horns to lift oncoming threats out of
the way and raises them into the air which is the direction of a bull market. Bears
tend to come down on you from above hence they represent a bearish market or
one that is falling.
The above desk figurines depict the back and forth of the market as it unpredictably tends to move in a preferred direction. They make good gifts for traders, stock brokers or financial advisors.
Featured are a number of pre-built screen categories. For instance, if you are looking for a specific short term candlestick chart pattern, there are about 40 pre-built candlestick pattern searches which you can select.
One of the great features of StockFetcher is that you can quickly search for any type of stock you want. For example, the text below is for a simple stock filter which looks for rising stocks between $1.00 and $50.00 where the volume is at least three times above the average volume and above 600000.
On November 20, 2024, StockFetcher found 3 stocks meeting the requirements of the code. The results were from Nov 19. From the scan, FTEK looked interesting and the stockchart provided by StockFetcher is shown below.

Stockfetcher Options
There are three levels of service:
Evaluation or free level - Anyone can access the free stock screener however, the data is a day old. This level of subscription also limits the features that you can access however, you can still build an excellent watch list using this level of subscription.
Standard – On Nov 20, 2024 this level cost US $8.95 per month or $24.95 for three months. It gives you access to all of the features of StockFetcher except the advanced filter support. You can backtest your ideas, build watch lists, go back in time, save up to 100 filters and get email alerts.
Advanced - This level cost US $16.95 per month or $44.95 for three months and gives you everything the standard version does except it includes increased save options and supports more powerful filters.
Features that made StockFetcher my preferred stock screener:
- Low cost;
- No data maintenance;
- Very good technical service;
- Can search daily or weekly data;
- Stock charts containing two years of data;
- Detailed user guide which is free to download;
- The ability to quickly write a filter which will identify any idea I have.
The one feature which StockFetcher does not currently offer is the ability to screen Canadian stocks on Canadian exchanges. It is for this reason, I switched to StockCharts.
StockFetcher Filters
To demonstrate how you can use StockFetcher as a free stock screener to build a watch list go to their Examples page (from the top menu) which features a number of pre-built screens.
As an example, on
November 20, 2024 using their MACD Bullish Crossover search, 5 stocks
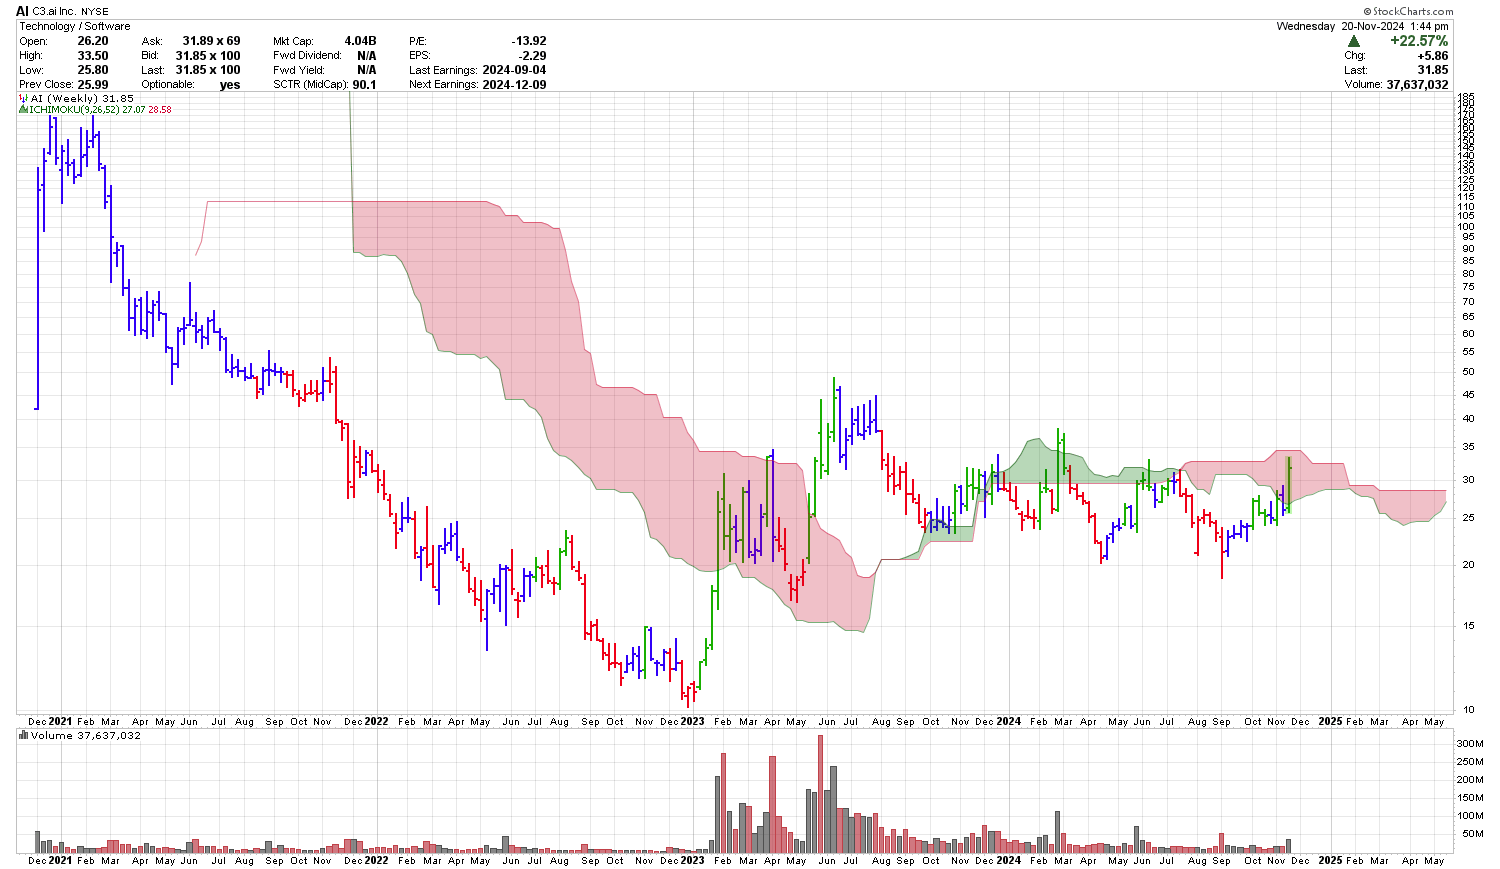
were shown out of the 121 potential stocks. From this list AI (C3Ai Inc)
looked interesting and is shown below along with a standard Ichimoku
Cloud. While the large move up is still in the cloud, the volume
suggests that better days are ahead for AI.
Keeping this stock on a watchlist as a potential buy sometime in the future may result in a profitable trade. It really depends on how AI trades over the coming weeks.

Chart courtesy of StockCharts.com
Another nice feature offered is the ability to look at all of the sectors and industries and see how they rank compared to each other. Right from the home page you can look at the sectors and industries and quickly sort the strongest or weakest ones by last day, week, month, 3 month, 6 month, 1 year and 2 year. This is a very visual table and will quickly give you an idea of where the money is flowing.
By clicking on the strongest industry you will see 5 stock charts from that industry. You can do the same thing with the sectors. This is a fantastic tool.
Under Examples (at the top of the page), they are currently featuring filters which are described as:
- MACD Bearish Crossover
- MACD Bullish Crossover
- Down on Big Volume
- Up on Big Volume
- New 52 Week Highs
- New 52 Week Lows Gap
- Down On Volume Gap
- Up On Volume
- RSI Bearish Crossover
Depending on whether you are using technical or fundamental analysis to search for stocks, there is a stock market screener out there for you. Experiment with a number of them and find one that works for you.
PS - As a full disclaimer, after almost 10 years of quality service, I stopped using StockFetcher. It is still a great tool and I really enjoyed being able to quickly put my ideas into code and screen for specific setups. I have moved off line and purchased AmiBroker. AmiBroker costs more than StockFetcher and you have to download your own data, which may cost you depending on the vendor you choose. There is also the data maintenance now which I did not have with StockFetcher. If you are looking for a good online stock screener, I would still recommend StockFetcher. I now also use StockCharts.
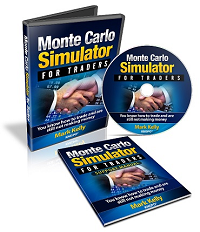
I have also found that learning about the number of loses one is willing to take while trading a particular trading system to be quite useful. Find out how I use the Monte Carlo Simulator for Traders to improve my trading.
Gifts for Stock Traders - Stock traders are a different breed. For the stock trader in your life or as a present to yourself consider getting a trading mug. This can be used throughout the day to sip on your favourite beverage and remind you that you are a trader.
Short Course
Introduction on How to Trade Stocks for Beginning Traders
New to trading, not sure where to start. I have put together a short course consisting of 18 lessons. Each lesson should take less than 5 minutes to review. Each lesson provides you with alternate resources to continue learning about that particular topic.
To learn more about this course and sign up please visit the course webpage by clicking the link below.
Monte Carlo Simulator
for Traders
 Having troubles sticking with your trading system?
Do you move from system to system looking for the one system that will bring you riches?
Perhaps you already have it and tossed it aside when it went into a down period.
Using this Excel based program will show you what you can expect out of your trading system once you know the % wins and profit factor.
Stop wasting your time searching for the perfect system (which does not exist) and start trading.
$20.00


