Follow your trading system like you stop at a red light
A trading system or trading plan is a set of rules which you follow when you trade. Good trading plans will tell you what to buy, when to buy it, how many shares to buy, how much to risk, identifies total account risk, when to take profits and when to exit the trade. It is like a road map, used by traders to guide them through the markets. Your trading systems should give you an edge in the markets provided you have back tested them and found them to be profitable.
Bulls and bears are used to describe the up and down of the market. A bull tends to use its horns to lift oncoming threats out of
the way and raises them into the air which is the direction of a bull market. Bears
tend to come down on you from above hence they represent a bearish market or
one that is falling.
The above desk figurines depict the back and forth of the market as it unpredictably tends to move in a preferred direction. They make good gifts for traders, stock brokers or financial advisors.
Then, it is up to you to trade it. This is the hard part of trading. Actually following your rules. To follow the same plan until it becomes habit before starting to trade a second plan.
Do You Stop At Stop Lights?
A good analogy, which I think you will understand, is driving a car and stopping at a red light. My guess is, that provided you drive a car and live in a relatively law abiding country, when you come to a red light you stop. You don’t stop sometimes or most of the times you stop all of the times. You know that when you don’t stop there is a reasonable probability that you will be in a car crash which could injure you for life.
Thus, by following this rule you have shown that you can follow rules.
Your Trading System is Your Stop Light
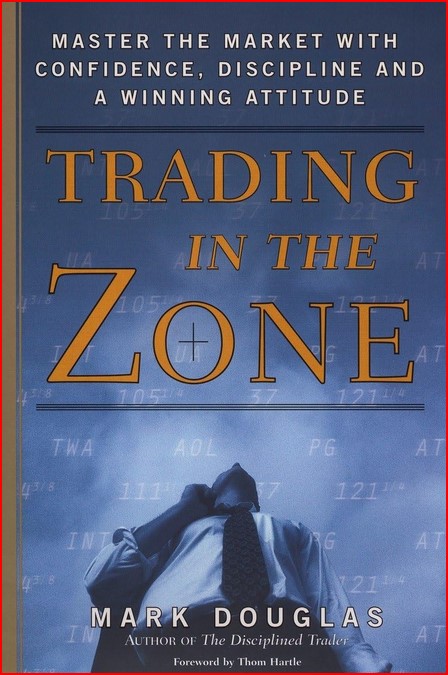
Yet when it comes to trading it is likely that most traders do not have a trading plan yet alone follow one. According to Mark Douglas in his book Trading in the Zone: Master the Market with Confidence, Discipline and a Winning Attitude once you have found an edge and can consistently trade it, you should be able to constantly pull money from the market over time even though the stocks that you trade will give you random results.
Just like stopping at red lights once you begin to consistently trade your system you will find that there are trades that work and those that do not. You will only know the outcome of a trade after the trade is completed and not before and there is no way of knowing prior to a trade where the stock is headed. You may have hunches but you have to remember that even your hunches have a probability associated with them.
I have not found anyone yet who can say with a great deal of confidence that 100% of their trades worked out, unless you are talking to someone who has only traded a few stocks all of which were winners. This is called luck and has no place in your trading system.
Trading System Example
Strategy Basdics
This strategy is looking for reasonable reward to risk entries in stocks. Identify stocks where the H-L > 1.5 x ATR(14) and the volume is > yesterdays volume. This method cannot and will not catch all of the moves. To win, I must do certain things in a certain way. To win, I will use this plan to interact with the market. This plan is one way out of thousands of ways I could have chosen, i.e., there is nothing special about this plan. This part of the plan, only identifies setups, it is how I manage the trade which will make me money.
Identify Stocks Using StockCharts
Run the scan at 1:30 MT. The system prefers lower priced stocks where the volume is higher than the volume yesterday.
Set Up
Identify the best trades based on daily data. The best trades will be above a recent consolidation which is clearly evident. When the (H-L)/ATR(14) > 2, the % wins increases however the risk is larger.
Evaluation
- Ensure that the daily chart is not filled with gaps
- Taking the 1st or 2nd opportunity seems to be better than taking extended trades
Bid
Buy a maximum of 1 or 2 stocks per day, buying near the close of the day.
Profit and Exit Rules
Initial stop loss is 5 cents below the recent low. It is best when the close is a new 20 day high and recent action is a short consolidation. Exit 1/3 of the position at the first profit target which is equivalent to the risk on the trade. Then raise the stop to the buy point.
Risk/Money Management
- Risk a maximum of 1% of the account on each trade
- Have a
maximum of 5 positions open at a time per account
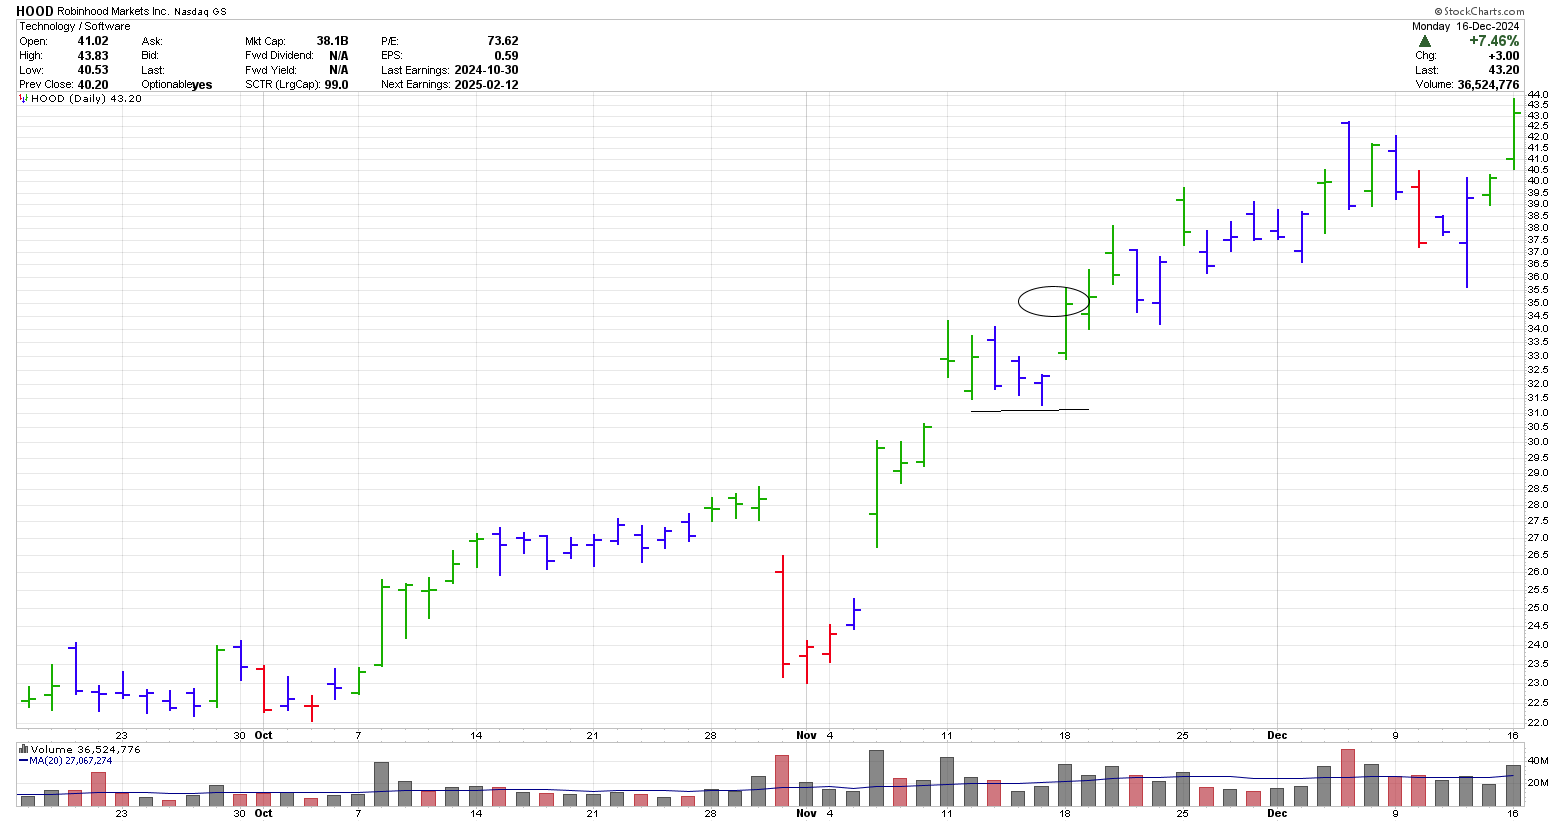
The trading system above is quite basic. It still required volume and pricing ranges to be added to it. Based on the volume and closing prices I used, on November 18, 2024, four stocks were identified which had met the basic criteria.
From a visual inspection of the 4 stocks, HOOD had the best consolidation, with increased volume and a clear new high. Not all stocks will end up being winners.
Need a little help in developing your trading plan? Then follow us over to the trading system page to begin your journey.
Unsure how to build a trading plan or design a system. Check out this resource to learn about writing your own trading plan and our page on understanding the stock market. which reviews a few different ways to trade the markets.
Gifts for Stock Traders - Stock traders are a different breed. For the stock trader in your life or as a present to yourself consider getting a trading mug. This can be used throughout the day to sip on your favourite beverage and remind you that you are a trader.
Monte Carlo Simulator
for Traders
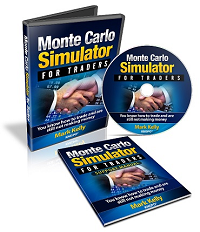 Having troubles sticking with your trading system?
Do you move from system to system looking for the one system that will bring you riches?
Perhaps you already have it and tossed it aside when it went into a down period.
Using this Excel based program will show you what you can expect out of your trading system once you know the % wins and profit factor.
Stop wasting your time searching for the perfect system (which does not exist) and start trading.
$20.00

