When to Sell Stock
is the Tricky Part
Don't let your profits turn to losses
When to sell stock is more important than when to buy. According to Van K. Tharp in Technical Analysis of Stocks and Commodities, April 1999, page 76 the entry into a stock position accounts for about 10% of your success while the exit accounts for about 30% of your success.
Bulls and bears are used to describe the up and down of the market. A bull tends to use its horns to lift oncoming threats out of
the way and raises them into the air which is the direction of a bull market. Bears
tend to come down on you from above hence they represent a bearish market or
one that is falling.
The above desk figurines depict the back and forth of the market as it unpredictably tends to move in a preferred direction. They make good gifts for traders, stock brokers or financial advisors.
Knowing When to Sell stock - will alter your profit, loss percentage
While you can buy many stocks in the stock market, provided you do not short, you can only sell the stocks you own.
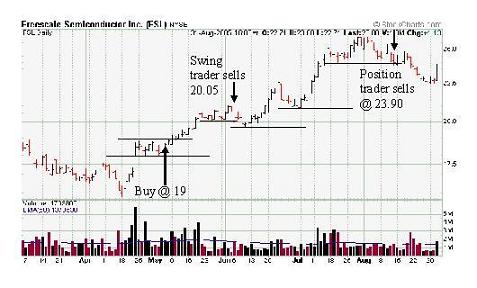
The time to get the price you want for a stock depends on your trading time frame, which is influenced by your trading style. The longer you plan to hold a stock, generally the further away from the market your sell stop should be. For instance, a swing trader may sell a stock based on one day's worth of information. A position trader may use weekly data or wait for a signal that the long-term direction of the stock is changing. The stock chart below illustrates this.
Chart courtesy of StockCharts.com

Let us compare how a swing trader might handle the above trade versus a position trader. Assume both traders purchased Freescale Semiconductor (FSL) on May 9, 2005 at $19.00, which is just above the high on April 26, 2005.
The swing trader decides to accept an initial loss of $ 0.25 until a profit is made. The swing trader slowly moves up the trailing sell stop as the price of the stock rises. Ultimately, the sell stop is placed just below the low on May 23 at $20.05. On June 6, the sell stop is hit and the swing trader is out at $20.05. Our swing trader made a profit of $1.05 or 5.5% before commission and slippage in 19 days. Knowing when to sell stock made this trader a profit.
The position trader sets an initial sell stop at $17.90, which is just below the low set on May 2. It is decided that the sell stop will only be moved after a new high is hit. The position trader holds on through the dip in early June where the swing trader sold. The position trader is a longer-term trader and needs to remember that when to sell stock is affected by his trading style.
After a new high is reached on June 20, the stop is moved to $19.60. The lows seen in the last part of June are above $19.60 and the position trader hangs on. After a new high is set on July 12, the sell stop is moved up to $20.70. The sell stop is again moved up on July 27 to $23.90. Then on August 12, the sell stop is hit and the position trader is out at $23.90. The position trader made a profit of $4.90 or 25.8% before commission and slippage in 64 days.
In the above case, the position trader pocketed more profit. However, there are many cases, where the stock weakens quickly and the swing trader ends up making a profit while the position trader takes a loss.
Hanging on to a stock during an uptrend is one of the harder skills to learn in trading. To make big gains you need to give up short-term profits but still need to know when to sell stock. However, at some point you need to be able to identify a short-term correction from a change in long-term trend.
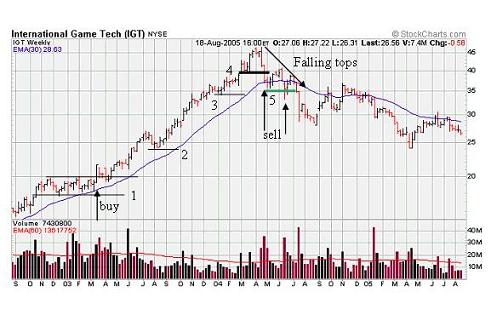
Let us look at a simple example using the three-year weekly chart of International Game Tech (IGT).
Chart courtesy of StockCharts.com

Say you were fortunate enough to buy just over $20 in mid-March 2003 on the above average volume breakout. Your first stop is set just below the consolidation at $17.95 (point #1). During the July/August 2003 time frame there was about a 10% pull back. This was above your stop.
By mid-September 2003, the stock is hitting new highs so you would want to move your stop up to point #2. By early March 2004, after hitting new highs, you might want to move your stop up to point #3, which is just below a small consolidation area.
Once the new highs are hit in April 2004, you might think about moving your stop up to #4, which is a consolidation area. If you were lucky enough to move your stop to #4, you would have been stopped out around $38.95 during the week of April 26, 2004.
If you missed the stop at point #4, as the slope of the 30-week EMA (blue line) started to flatten out in May, you should have definitely moved your stop up to $35.40 or just below the low of the week beginning May 10, 2004. This stop would have been hit during the week of July 14, 2004.
Once you start to see falling tops and flattening long term averages it is best to sell and move on. If you do not know when to sell stock, you shift from being a trader to becoming an investor.
Selling is all about discipline. To learn more about discipline and when to sell stock read our discipline section.
To learn a lot more about trading system development read Van Tharp's book Trade Your Way to Financial Freedom.
Gifts for Stock Traders - Stock traders are a different breed. For the stock trader in your life or as a present to yourself consider getting a trading mug. This can be used throughout the day to sip on your favourite beverage and remind you that you are a trader.
Monte Carlo Simulator
for Traders
 Having troubles sticking with your trading system?
Do you move from system to system looking for the one system that will bring you riches?
Perhaps you already have it and tossed it aside when it went into a down period.
Using this Excel based program will show you what you can expect out of your trading system once you know the % wins and profit factor.
Stop wasting your time searching for the perfect system (which does not exist) and start trading.
$20.00


