Determining Which Stock to Buy
Which stock to buy for long term gain is easy to figure out after the fact yet not so easy on the day that you want to buy.
Do you know which stock to buy or how to pick stocks? You may have heard some of the following: buy new highs, buy strong stocks in strong sectors, buy moving average crossovers or buy dividend stocks because they are safe. However, in many cases, which stock to buy is dependent on what type of trader you are and what your goals are.
How to know which stock to buy?
Bulls and bears are used to describe the up and down of the market. A bull tends to use its horns to lift oncoming threats out of
the way and raises them into the air which is the direction of a bull market. Bears
tend to come down on you from above hence they represent a bearish market or
one that is falling.
The above desk figurines depict the back and forth of the market as it unpredictably tends to move in a preferred direction. They make good gifts for traders, stock brokers or financial advisors.

In order to know how to pick stocks, first you need to know what type of a stock market trader you are. For the purposes of this site, here are some types of traders and the types of stocks they may choose to buy.
Scalpers and day traders generally do not really care about what they trade as long as the stock trades a lot of volume, is volatile and offers a short-term trading opportunity. When you are new to the stock market, you should likely not be in this group. This group plays a fast game and beginners are likely to lose a lot of their capital.
Typically these traders would be looking to trade using charts under 30 minutes and more likely in the 1 to 5 minute time frame. For these traders they want to be in and out in within the day and as long as the stock is trade-able today, they don't really care if it is not around in a month.
A swing trader is looking for a short-term move lasting days to weeks. They would generally exit a trade at the first signs of weakness. A swing trader would likely be looking for a stock that is going in the same direction as the market but may go against the market direction in specific cases. Keeping their risk under control and with a desire to make a large reward to risk ratio in a short period of time.
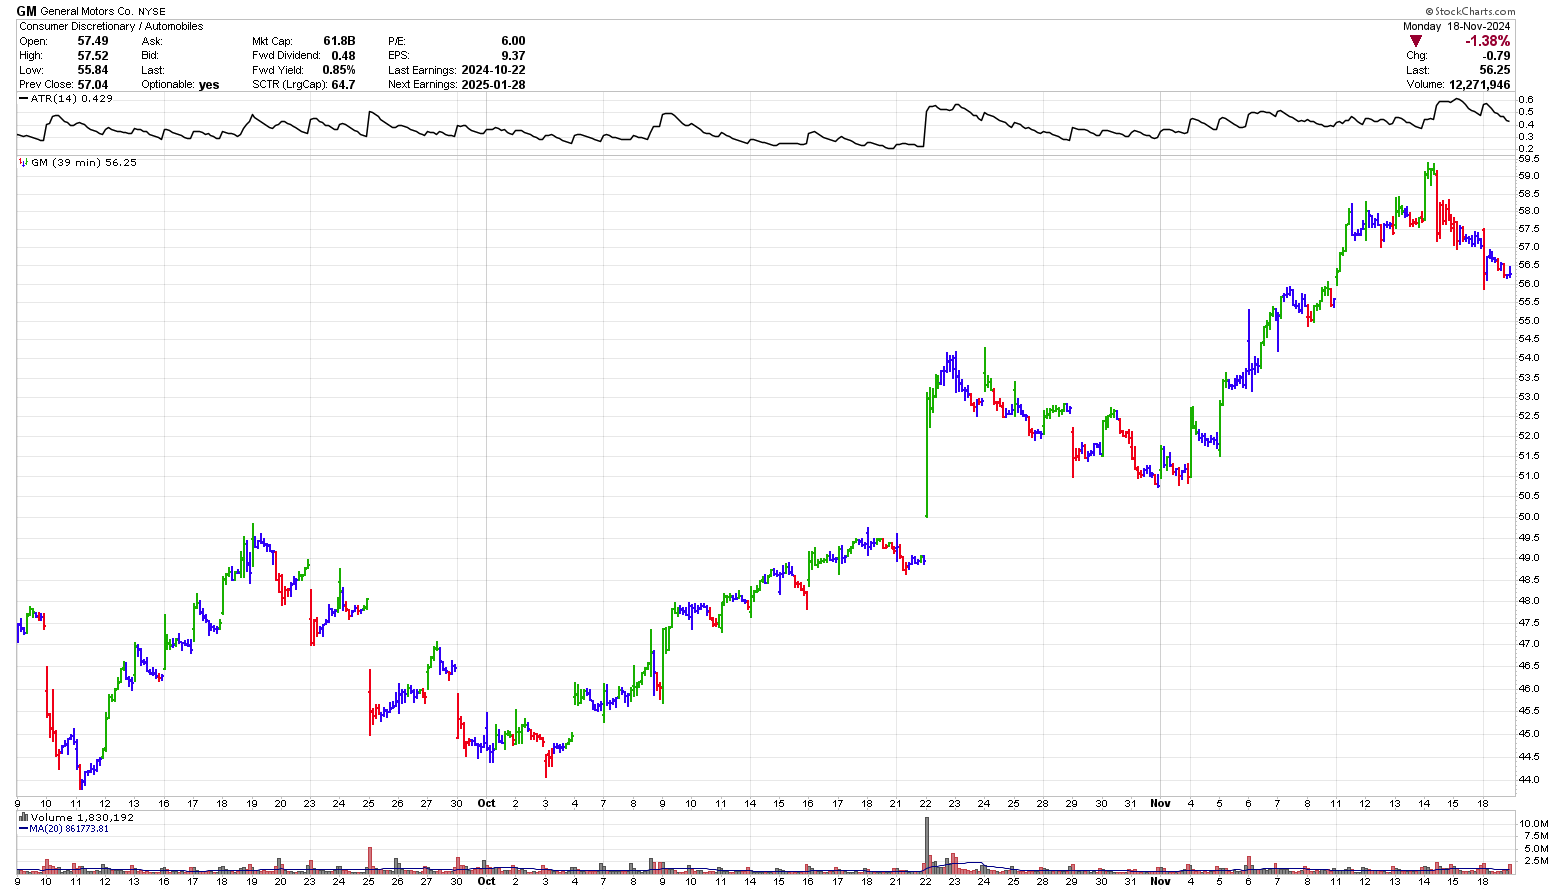
Consider the 39-minute stock chart of GM in early October 2024 when the low of Oct 3 was just above the low on September 11. On October 4 the stock jumped up in price and stayed in a pretty tight range for 2 days.
A swing trader might buy a breakout from this short pattern with the assumption that whatever caused the gap will move the stock higher. In this case, the exit would be just under the low on Oct 7 or 44.99 which is just below the high prior to the gap. The buy is $46.13 or just above the high of the gap. The risk is $1.14 or about 2.5%. Buy 200 shares for a risk of $228.
The trader then moves the stop loss to each new inflection point after a new high is reached. With a stop at $48.49 on September 21 the trader sees the large gap on September 22 and monitors it closely. A decision to sell 100 shares at $52.39 is made after the inflection point on Sept 23 forms. These shares are sold on Sept 25.

Chart courtesy of StockCharts.com
The stock continues to drop yet does not hit the stop at $48.39. As the price continues to go higher the stop keeps being increased until it is at $56.89 and then the final shares are sold on November 18. Total profit is about $1,852.
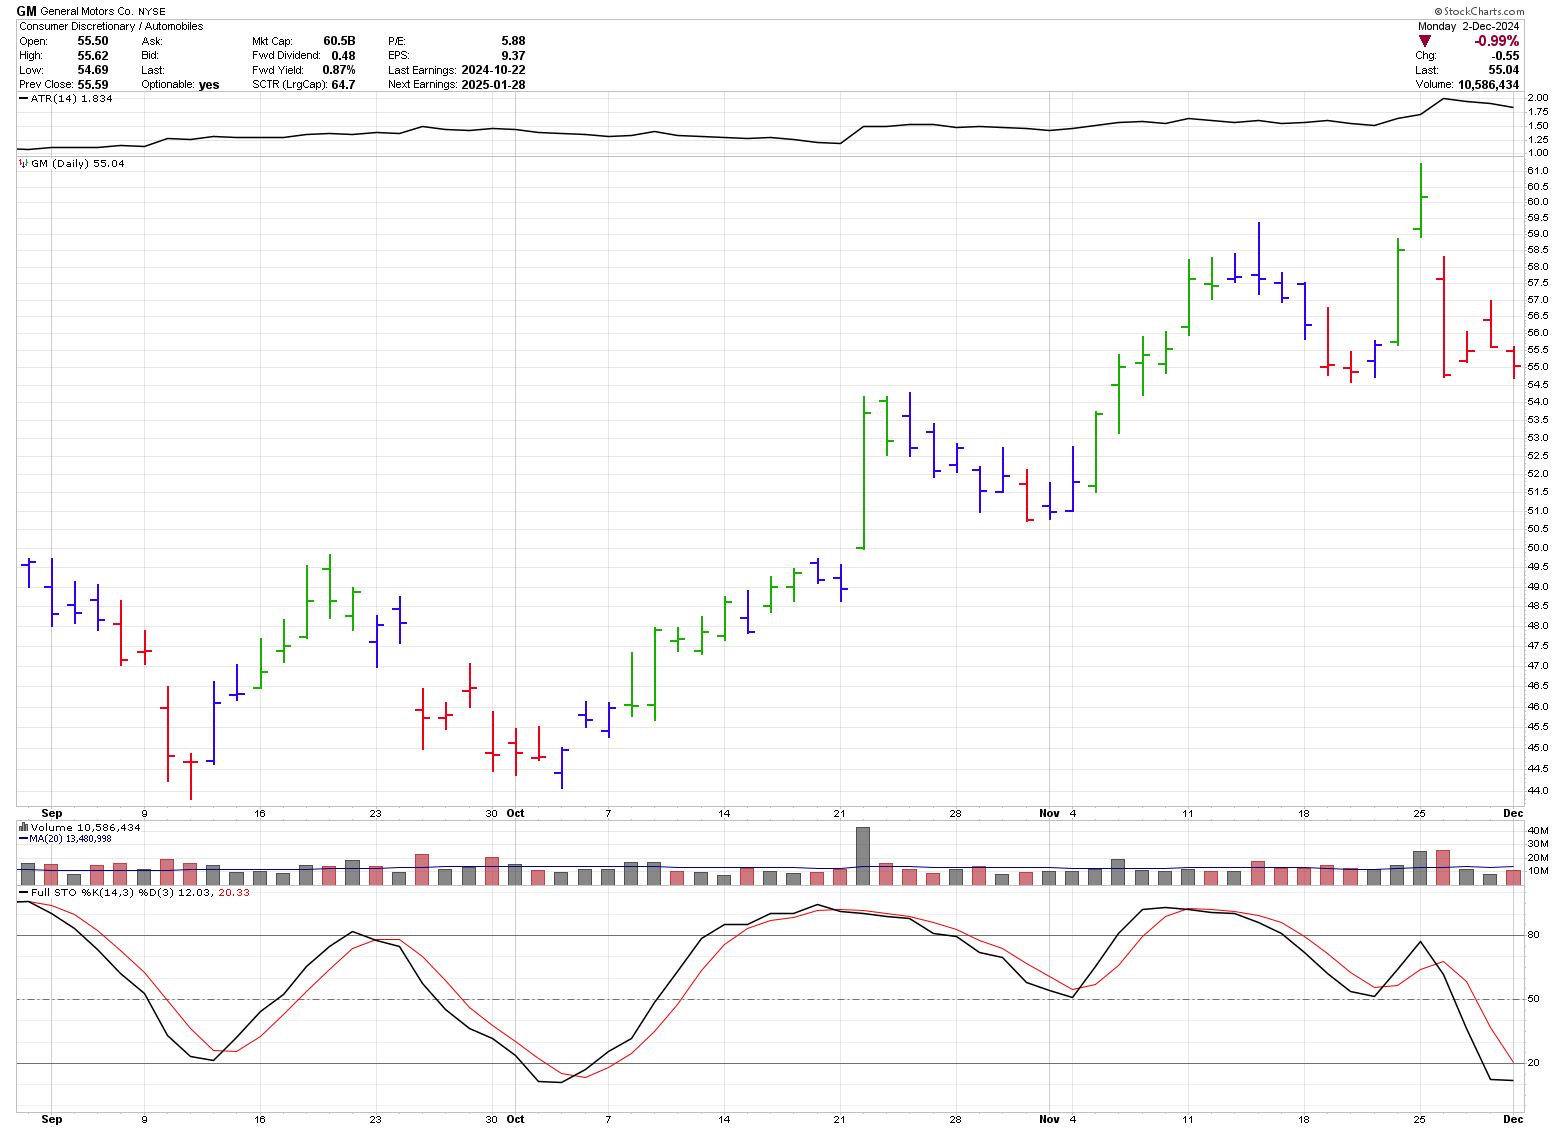
Now compare the above trade to a position trade which is shown below. In this case, the trader uses a daily chart and sees the same low in early October and the gap. As a position trader the buy is still at $46.13 yet the stop loss is placed lower at $42.59 which is about one ATR below the low of September 11, 2024. Now the risk is $3.54 and therefore only 64 shares are bought to align with the same risk taken by the swing trade.

For this trade, the low in early October was supported by the gap break and the cross seen in the Stochastic indicator. As before, the trader continues to raise their stop with each successive new high and now has a stop in at $54.39. When this gets taken out the profit on the trade will be about $528.
No matter how much knowledge you posses, there is always the probability of a loss
A position trader is looking for a long-term move lasting weeks to months. They would generally try and ride most of an up cycle and hang on to the dips along the way. Position traders can be looking for stocks where a change in trend has occurred.
A value investor
is looking for a stock which is perceived to be selling for less than
it will be worth in the future. Value investors generally use
fundamental analysis to try and determine what a stock is worth. Here,
which stock to buy is critical due to the generally long duration of
your holding period. The investor would want a company that continues to increase sales and profits and possibly a dividend.
Generally, which stock to buy becomes less important, the shorter your trading time frame.
The volume
a stock trades in a day may be a concern for you when picking a stock.
When the volume is too small, generally less than 50,000 shares per day,
it may be difficult to get out of the stock quickly. Also, if you are
planning on buying thousands of shares, you may increase the price of
the stock with your buying. Limit orders can be useful for these low volume stocks.
You could also follow a tried and true
saying, "The trend is your friend." Simply put, you generally should not
be buying stocks in a downtrend. Also, the trend is your friend until it isn't.
For another approach on how to pick stocks or which stock to buy read Stan Weinstein's "Secrets for Profiting in Bull and Bear Markets."
Gifts for Stock Traders - Stock traders are a different breed. For the stock trader in your life or as a present to yourself consider getting a trading mug. This can be used throughout the day to sip on your favourite beverage and remind you that you are a trader.
Monte Carlo Simulator
for Traders
 Having troubles sticking with your trading system?
Do you move from system to system looking for the one system that will bring you riches?
Perhaps you already have it and tossed it aside when it went into a down period.
Using this Excel based program will show you what you can expect out of your trading system once you know the % wins and profit factor.
Stop wasting your time searching for the perfect system (which does not exist) and start trading.
$20.00


